Normal Distribution: Normal approx; advanced — NJC 2025 H2 Math Prelim Paper 2
What this question tests
Question
The fasting glucose concentration in millimoles per litre (mmol/L) of a randomly chosen man and a randomly chosen woman is normally distributed with mean and standard deviation as given in the table below.
| Mean | Standard deviation | |
|---|---|---|
| Man | 5.4 | 0.5 |
| Woman | 5.0 | 0.3 |
- If one man and one woman are chosen randomly, find the probability that the man's fasting glucose concentration exceeds the woman's. State an assumption you make in your calculation.
- The fasting glucose concentration of at most 3% of men exceeds \(5.4\,\text{mmol/L}\) by \(c\) mmol/L. Find the range of \(c\).
- For \(k > 5.4\), explain which of the following has a larger value:
- \(p_1\): the probability that the fasting glucose concentration of a randomly chosen man is greater than \(k\), or
- \(p_2\): the probability that the mean fasting glucose concentration of four randomly chosen women is greater than \(k\).
Fasting glucose concentration can also be measured using milligram per decilitre (mg/dL). The formula to convert mmol/L to mg/dL is \[ 1\,\text{mmol/L} = 18.0\,\text{mg/dL}. \] The random variable \(G\) denotes the fasting glucose concentration, in mg/dL, of a randomly chosen man.
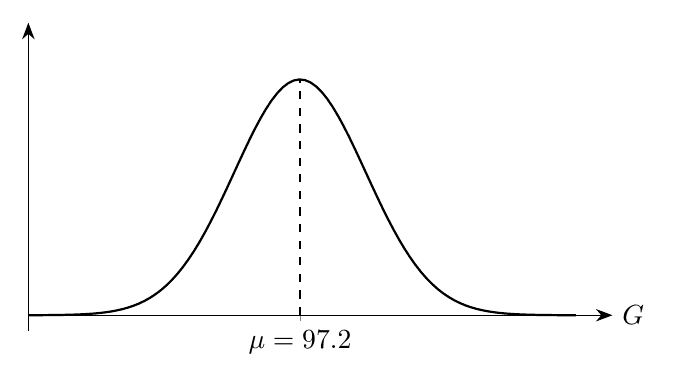
- Draw a sketch to show the distribution of \(G\), including the main features of the curve.
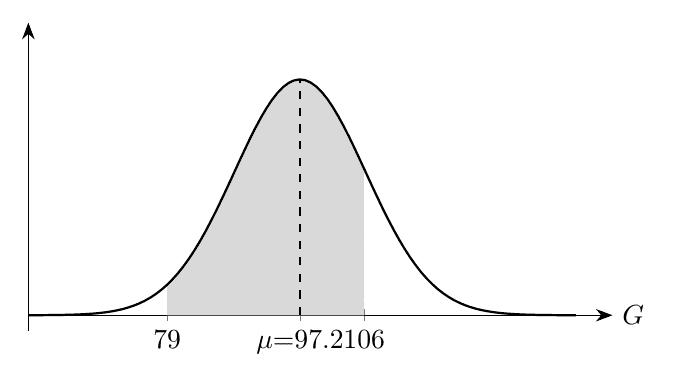
- On your sketch, shade the region represented by \(\mathrm{P}(79 < G < 106)\) and state its value.
Show full worked solution▾
(a)
Let \(X\sim\mathrm{N}(5.4,\,0.5^2)\) and \(Y\sim\mathrm{N}(5.0,\,0.3^2)\) be the fasting glucose concentrations of a man and woman respectively. \[\begin{aligned} X - Y &\sim \mathrm{N}(5.4-5.0,\; 0.5^2+0.3^2) = \mathrm{N}(0.4,\; 0.34)\\[4pt] \mathrm{P}(X>Y) &= \mathrm{P}(X-Y>0) \end{aligned}\]
(b)
\(X\sim\mathrm{N}(5.4,\,0.5^2)\). Require \(\mathrm{P}(X-5.4 \geq c) \leq 0.03\): \[\begin{aligned} \mathrm{P}\!\left(Z \geq \frac{c}{0.5}\right) &\leq 0.03\\[4pt] \frac{c}{0.5} &\geq 1.880794\\[4pt] c &\geq 0.940 \end{aligned}\]
(c)
\(X\sim\mathrm{N}(5.4,\,0.5^2)\) and \(\bar{Y} = \dfrac{Y_1+Y_2+Y_3+Y_4}{4}\sim\mathrm{N}\!\left(5.0,\,\dfrac{0.3^2}{4}\right)\).
Method 1 \[\begin{aligned} p_1 &= \mathrm{P}(X>k) = \mathrm{P}\!\left(Z > \frac{k-5.4}{0.5}\right)\\[4pt] p_2 &= \mathrm{P}(\bar{Y}>k) = \mathrm{P}\!\left(Z > \frac{k-5.0}{0.15}\right) \end{aligned}\]
For \(k > 5.4\): \(\dfrac{k-5.0}{0.15} > \dfrac{k-5.4}{0.5}\), so \(p_2 < p_1\).
Method 2: Graphical
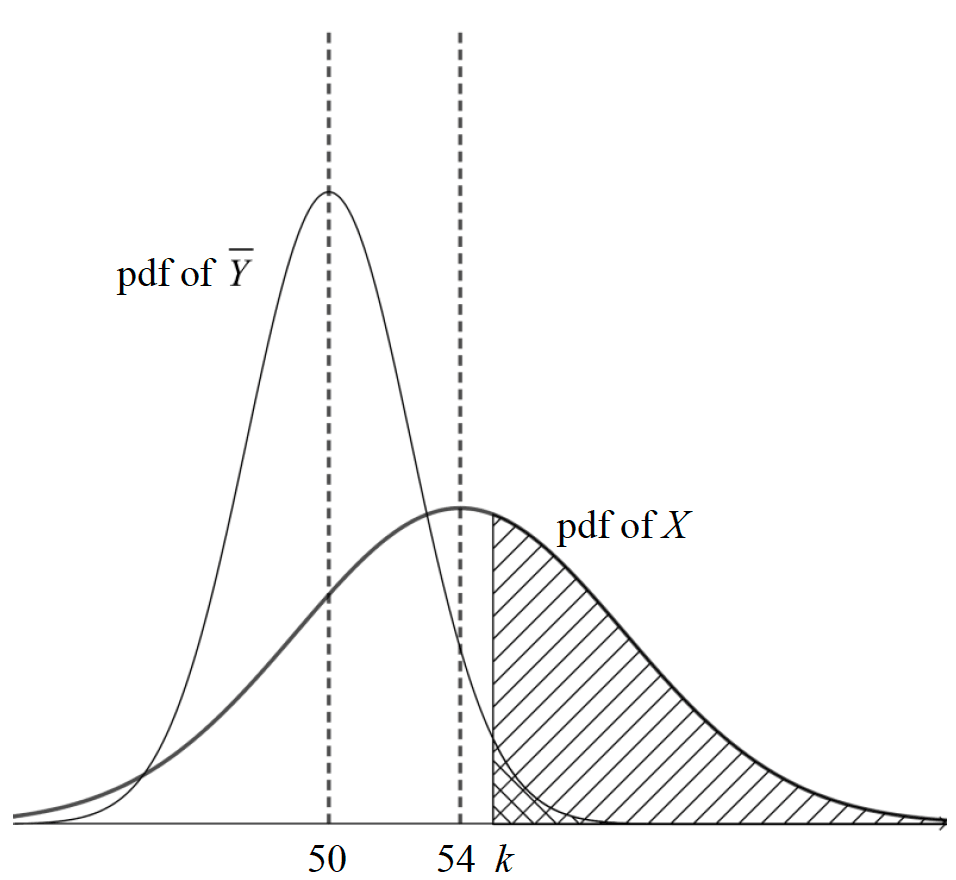
By comparing the shaded areas in the diagram, \(p_1 > p_2\).
(d)
\(G = 18.0X \sim \mathrm{N}(97.2,\; 18.0^2 \times 0.5^2) = \mathrm{N}(97.2,\; 81.0)\).
(e)
\(G\sim\mathrm{N}(97.2,\,81.0)\).