
Correlation & Regression: Regression + PMCC + estimate — RI 2025 H2 Math Prelim Paper 2
Raffles Institution2025 PrelimPaper 2●●○ Standard10 marks
What this question tests
Regression + PMCC + estimate.
Question
A small café sells one type of coffee. The selling price of a cup of coffee is reviewed and adjusted at the beginning of every year depending on market conditions. Based on sales figures collected over 7 years, the café owner, Mr Tay, studied the effect of the selling price of a cup of coffee, \$x, on the average number of cups, \(y\) cups, sold per day within the year. The data is shown in the table below.
| \(x\) | 2.0 | 2.2 | 2.5 | 3.0 | 4.0 | 4.4 | 4.5 |
|---|---|---|---|---|---|---|---|
| \(y\) | 280 | 250 | 190 | 150 | 90 | 100 | 70 |
Show full worked solution▾
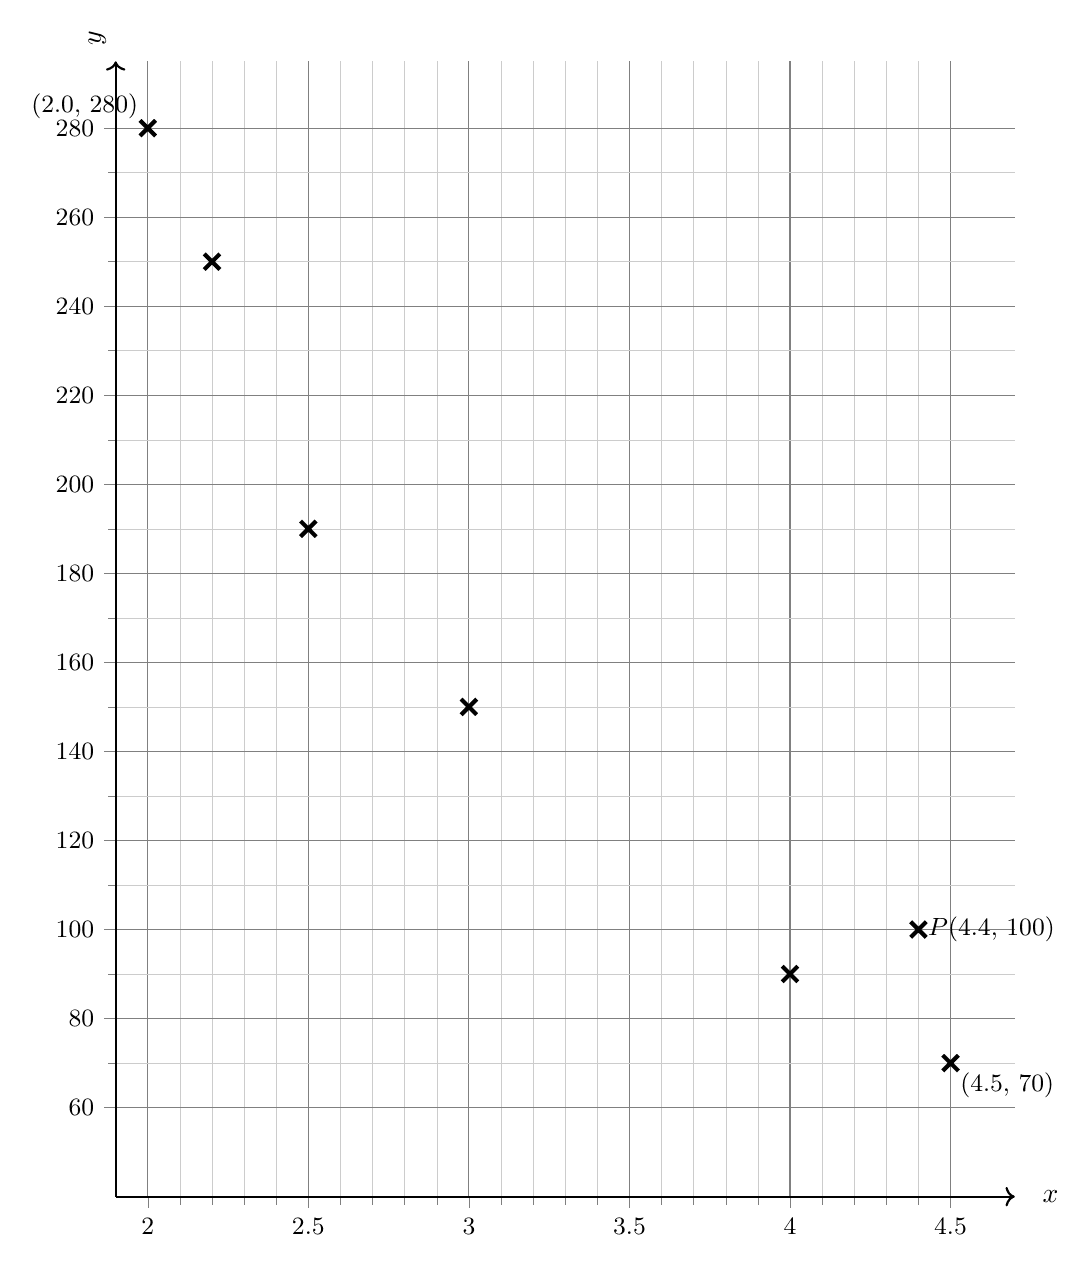
The anomalous point is \(P(4.4, 100)\) — it appears too high compared with the trend.
The 6 remaining data points give: \[\begin{aligned} r &= 0.998 \text{ (3\,s.f.)}\\[4pt] a &= -101 \text{ (3\,s.f.)}\\[4pt] b &= 757 \text{ (3\,s.f.)} \end{aligned}\]
This estimate is reliable because:
- \(r = 0.998 \approx 1\), indicating a very strong positive linear correlation between \(y\) and \(\dfrac{1}{x}\), suggesting the model \(y = a + \dfrac{b}{x}\) is appropriate.
- \(x = 4.4\) lies within the range of given data \([2.0, 4.5]\), so this is interpolation rather than extrapolation.
Answer: (c) \(r = 0.998\), \(a = -101\), \(b = 757\) (d) Estimated value: \(y \approx 71.2\) (i.e. the correct data value should be approximately 71).