
Correlation & Regression: Advanced; model selection — SAJC 2025 H2 Math Prelim Paper 2
What this question tests
Question
- Sketch a scatter diagram that might be expected when \(x\) and \(y\) are related approximately as given in each of the cases (A) and (B) below. In each case your diagram should include 6 points, approximately equally spaced with respect to \(x\), and with all \(x\)- and \(y\)-values positive. The letters \(a\), \(b\), \(c\) and \(d\) represent constants.
(A) \(y = a + bx^2\), where \(a\) is positive and \(b\) is negative,
(B) \(y = c + \dfrac{d}{x}\), where \(c\) is positive and \(d\) is positive.
Alvin is investigating the relationship between the amount of screen time per day and the sleep quality of youths. He recorded the sleep quality score, \(y\), on a scale of 1 to 10 with 1 being the worst and 10 being the best, of particular youths with \(x\) hours of screen time per day.
| \(x\) | 1.6 | 1.7 | 1.9 | 2.0 | 2.5 | 2.8 | 3.9 |
|---|---|---|---|---|---|---|---|
| \(y\) | 9 | 8 | 7 | 6 | 4 | 3 | 1 |
- Draw a scatter diagram for these values, labelling the axes.
- Explain which of the two cases in part (i) is the most appropriate for modelling these values and calculate the product moment correlation coefficient for this case.
- Alvin wants to estimate the sleep quality score when the screen time per day is 3 hours. Use the case that you have identified in part (iii) to find the equation of a suitable regression line and use your equation to find the required estimate. Explain whether you would expect this estimate to be reliable.
- Write the equation from part (iv) in terms of \(y\) and \(t\), where \(t\) is the amount of screen time per day in minutes. Explain whether the product moment correlation coefficient for this case differs from the one found in part (iii).
- Alvin concluded that this study shows that increased amount of screen time per day causes poorer sleep quality. Explain whether you agree with his conclusion.
Show full worked solution▾
(i) Sketch of possible scatter diagrams:
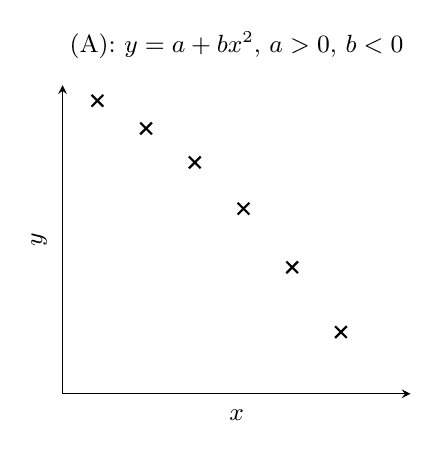
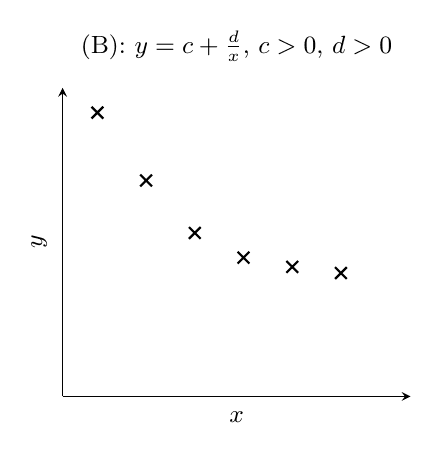
(ii) Scatter diagram of \(y\) (sleep quality score) against \(x\) (hours of screen time):
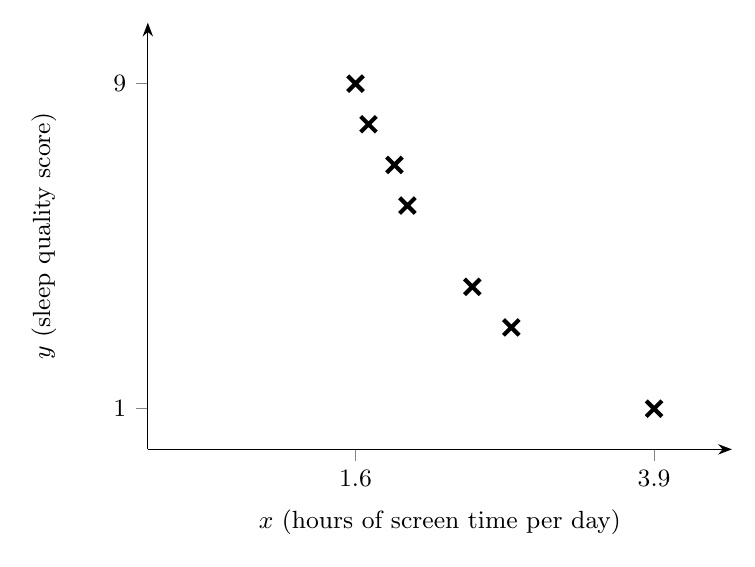
(iii) From the scatter diagram, as \(x\) increases, \(y\) decreases at a decreasing rate. Case (B) is the most appropriate model. \[ r = 0.99868 \approx 0.999\text{ (3 s.f.)} \]
(iv) Case (B): \(y = -4.6636 + \dfrac{21.716}{x}\), i.e. \(y \approx -4.66 + \dfrac{21.7}{x}\) (3 s.f.)
When \(x = 3\): \[ y = -4.6636 + \frac{21.716}{3} = 2.5751 \]
(v) Since \(t = 60x\): \[ y = -4.6636 + \frac{21.716(60)}{60x} = -4.6636 + \frac{1303.0}{t} \approx -4.66 + \frac{1300}{t}\text{ (3 s.f.)} \]
(v) cont. No, the \(r\) value does not differ / stays the same, as it is unaffected by change of units (scaling).
(vi) I disagree with Alvin because the outcome of the study determines how sleep quality is linearly correlated to the amount of screen time and does not imply that the increased amount of screen time causes poorer sleep quality.