
Correlation & Regression: PMCC; interpretation — TMJC 2025 H2 Math Prelim Paper 2
What this question tests
Question
A car dealer is investigating how the value of a car depreciates over time. A random sample of eight cars of the same model is selected and the current resale value, \(y\) thousand dollars of each car is recorded along with its age in \(x\) years. The results are shown in the table.
| {c|}} | ||||||||
|---|---|---|---|---|---|---|---|---|
| Age of car (\(x\) years) | 0 | 1 | 2 | 3 | 4 | 5 | 6 | 7 |
| Resale value (\(y\) thousand dollars) | 30.0 | 25.8 | 22.3 | 19.2 | 16.5 | 14.4 | 12.5 | 10.9 |
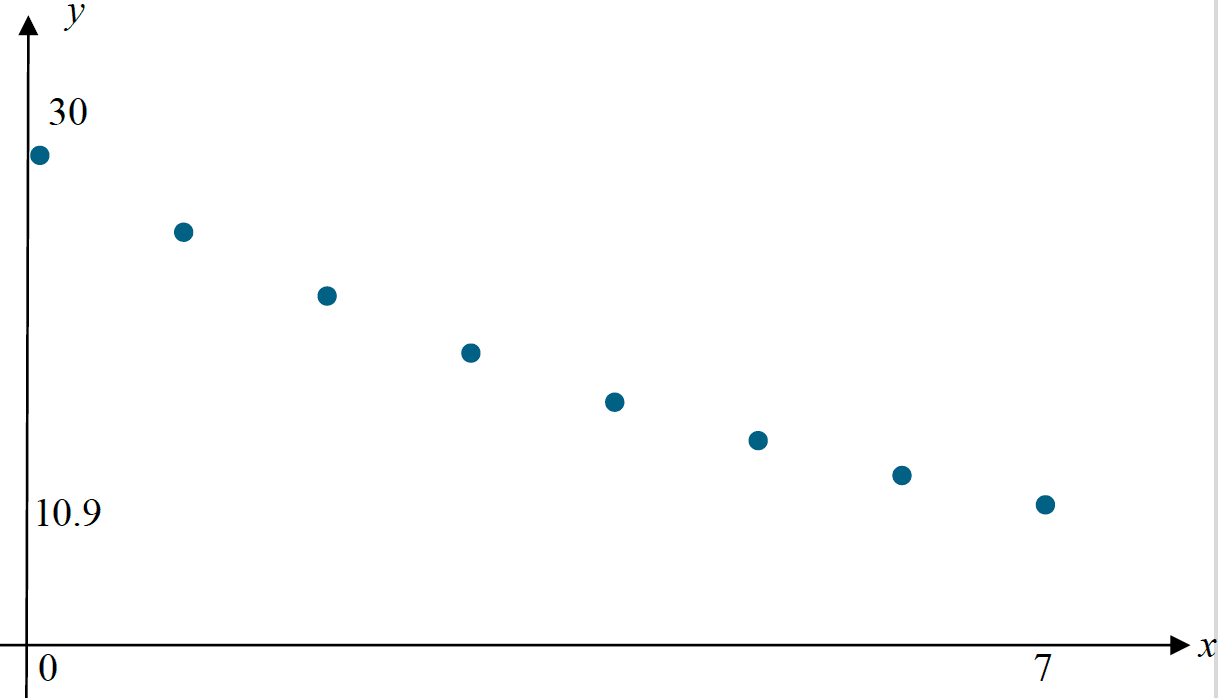
(a) Draw the scatter diagram for these values, labelling the axes clearly.
It is thought that the resale value of a car, \(y\), can be modelled by one of the formulae \[ y = a + bx \quad\text{or}\quad \ln y = c + dx, \] where \(a\), \(b\), \(c\) and \(d\) are real constants.
(b) Find, correct to \(5\) decimal places, the value of the product moment correlation coefficient between
- (i) \(y\) and \(x\),
- (ii) \(\ln y\) and \(x\).
(c) Use your answers to parts (a) and (b) to explain which of \(y = a + bx\) and \(\ln y = c + dx\) is the better model.
It is required to estimate the age of a car with a resale value of \$\(18000\).
(d) Find the equation of a suitable regression line and use it to find the required estimate.
(e) Without the use of a graphing calculator, re-write your equation from part (d) so that it can be used to estimate the resale value when the age is given in months.
Show full worked solution▾
(a) Scatter diagram for the data:
Figure 5
(b) Using GC,
- (i) for \(y\) and \(x\): \(r = -0.987510\ldots \approx -0.98751\) (5 d.p.);
- (ii) for \(\ln y\) and \(x\): \(r = -0.999839\ldots \approx -0.99984\) (5 d.p.).
(c) From the scatter diagram in (a), as \(x\) increases \(y\) decreases at a decreasing rate (the data curve flattens). This non-linear pattern argues against \(y = a + bx\) (a straight-line model in \(x\)). From (b), the PMCC between \(\ln y\) and \(x\) is closer to \(-1\) than that between \(y\) and \(x\). Hence \(\ln y = c + dx\) is the better model.
(d) Using GC, the suitable regression line is \[ \ln y = 3.3943\ldots - 0.14493\ldots\, x \approx 3.39 - 0.145\,x. \] When \(y = 18\): \[\begin{aligned} \ln 18 &= 3.3943 - 0.14493\,x\\ x &= 3.4770\ldots \approx 3.48 \text{ years}. \end{aligned}\]
(e) If the age in months is \(X = 12x\), i.e. \(x = \dfrac{X}{12}\). Substituting, \[\begin{aligned} \ln y &= 3.3943 - 0.14493\!\left(\frac{X}{12}\right)\\ &= 3.3943 - 0.012078\,X\\ &\approx 3.39 - 0.0121\,X. \end{aligned}\]