
Correlation & Regression: Regression; estimate — CJC 2025 H2 Math Prelim Paper 2
What this question tests
Question
A teacher conducts a survey on 7 students to investigate the relationship between the number of hours (\(h\)) of “screen-time” per week and the average scores (\(s\)) they obtained in a recently concluded examination. She records her findings as shown in the following table.
| \(h\) | 8.5 | 14 | 20 | 27 | 10.5 | 17 | 23 |
|---|---|---|---|---|---|---|---|
| \(s\) | 68 | 61 | 44 | 12 | \(\alpha\) | 58 | 31 |
- Given that the regression line of \(s\) on \(h\) is \(s = -3.00799h + 100.27974\), show that \(\alpha = 67.0\).
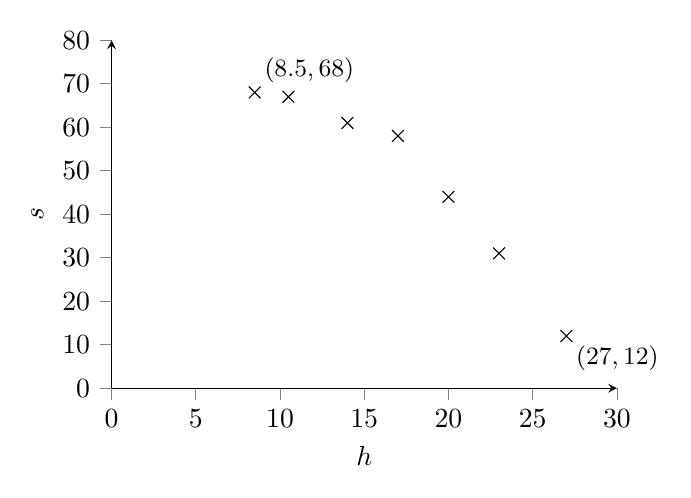
- Draw a scatter diagram for the data.
- Explain why \(s = kh^2 + c\) is the better model compared to the one in part (a), by giving appropriate reasons. State the values of \(k\) and \(c\).
- Using the better model, estimate the score a student can expect to obtain if he spends 7 hours of screen-time a week. Comment on the reliability of the estimate obtained.
- The teacher observes a trend from her findings and concludes with a statement: Increased screen-time will cause the exam scores to decrease. Comment on the validity of the statement.
Show full worked solution▾
(a) \(s = -3.00799h + 100.27974\). From GC, \(\bar{h} = 17.1429\). \[\begin{aligned} \bar{s} &= -3.00799(17.1429) + 100.27974 = 48.7140\\ \frac{68+61+44+12+\alpha+58+31}{7} &= 48.7140\\ 274+\alpha &= 340.998\\ \alpha &= 67.0\quad\text{(shown)} \end{aligned}\]
(b) Scatter diagram of \(s\) against \(h\):
(c) The \(r\)-value between \(s\) and \(h\) is \(-0.961\). The \(r\)-value between \(s\) and \(h^2\) is \(-0.991\), which is closer to \(-1\), indicating a stronger linear correlation between \(s\) and \(h^2\).
Also, from the scatter diagram, as \(h\) increases, \(s\) decreases at an increasing rate, indicating that the curve does not have a linear behaviour.
From GC: \(k = -0.0873\) and \(c = 77.7\). Hence \(s = -0.0873h^2 + 77.7\).
(d) When \(h=7\): \[ s = -0.087331(7)^2 + 77.727 = 73.4\text{ (3 s.f.)} \] Since \(h=7\) is outside the data range (\(8.5\leq h\leq 27\)), the estimate is obtained via extrapolation and thus is not reliable.
(e) Correlation is not causation. There may be other factors that contribute to this trend, so the statement is not valid.