
Free practice / Secondary 3 A Maths
Sec 3 A Math: Trigonometric Equations & Graphs, practice questions & worked solutions
Trigonometric Equations & Graphs practice questions selected from 2025 Singapore school A Math prelim papers, each with a full worked solution.
About this topic & key methods
These questions practise Sec 3 topics; the source papers are Sec 4 prelims. Questions requiring later Sec 4 methods are excluded.
Attempt each question on paper before opening its worked solution. Keep the source question number when checking against the original paper.
Key methods
- Read or calculate amplitude, period and vertical displacement.
- Sketch a trigonometric graph over the stated interval.
- Find every solution of a trigonometric equation in the given range.
- Use a sinusoidal model to interpret a practical situation.
For guided practice, see our Sec 3 A Maths tuition programme.
Questions & worked solutions
Unless the question specifies otherwise, give numerical answers to 3 significant figures and angles in degrees to 1 decimal place. Angles in radians are stated explicitly.
Trigonometric Graphs
It is given that and .
State the period and amplitude of .
State the period and amplitude of .
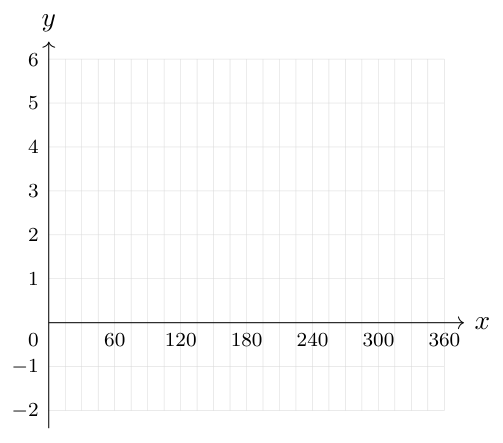
Sketch, on the same axes, the graphs of and for .
Show worked solution▾
(a)
(b)
(c)
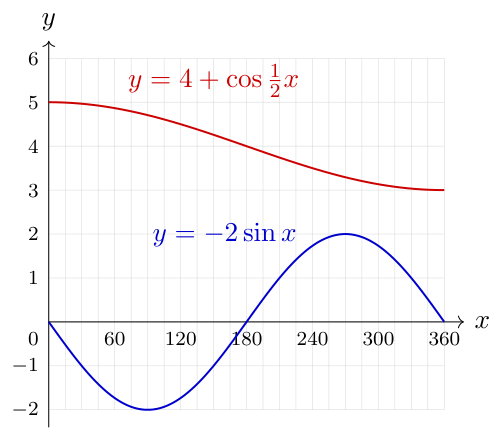
| Shape | cosine | negative sine |
| Amplitude | 1 | 2 |
| No. of cycle | Half | 1 |
| Shift | 4 | - |
Trigonometric Equations
Solve for .
Show worked solution▾
Let .
Trigonometric Functions
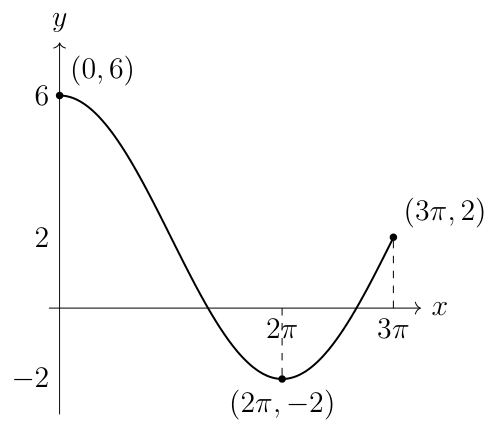
A function is given by , where and are constants. The maximum value of is 6 and the period of is .
State the amplitude of .
Write down the value of and of .
Sketch the graph of for , indicating clearly the coordinates of the maximum and minimum points.
Show worked solution▾
(a)
Amplitude .
(b)
(c)
for .
Trigonometric Graphs
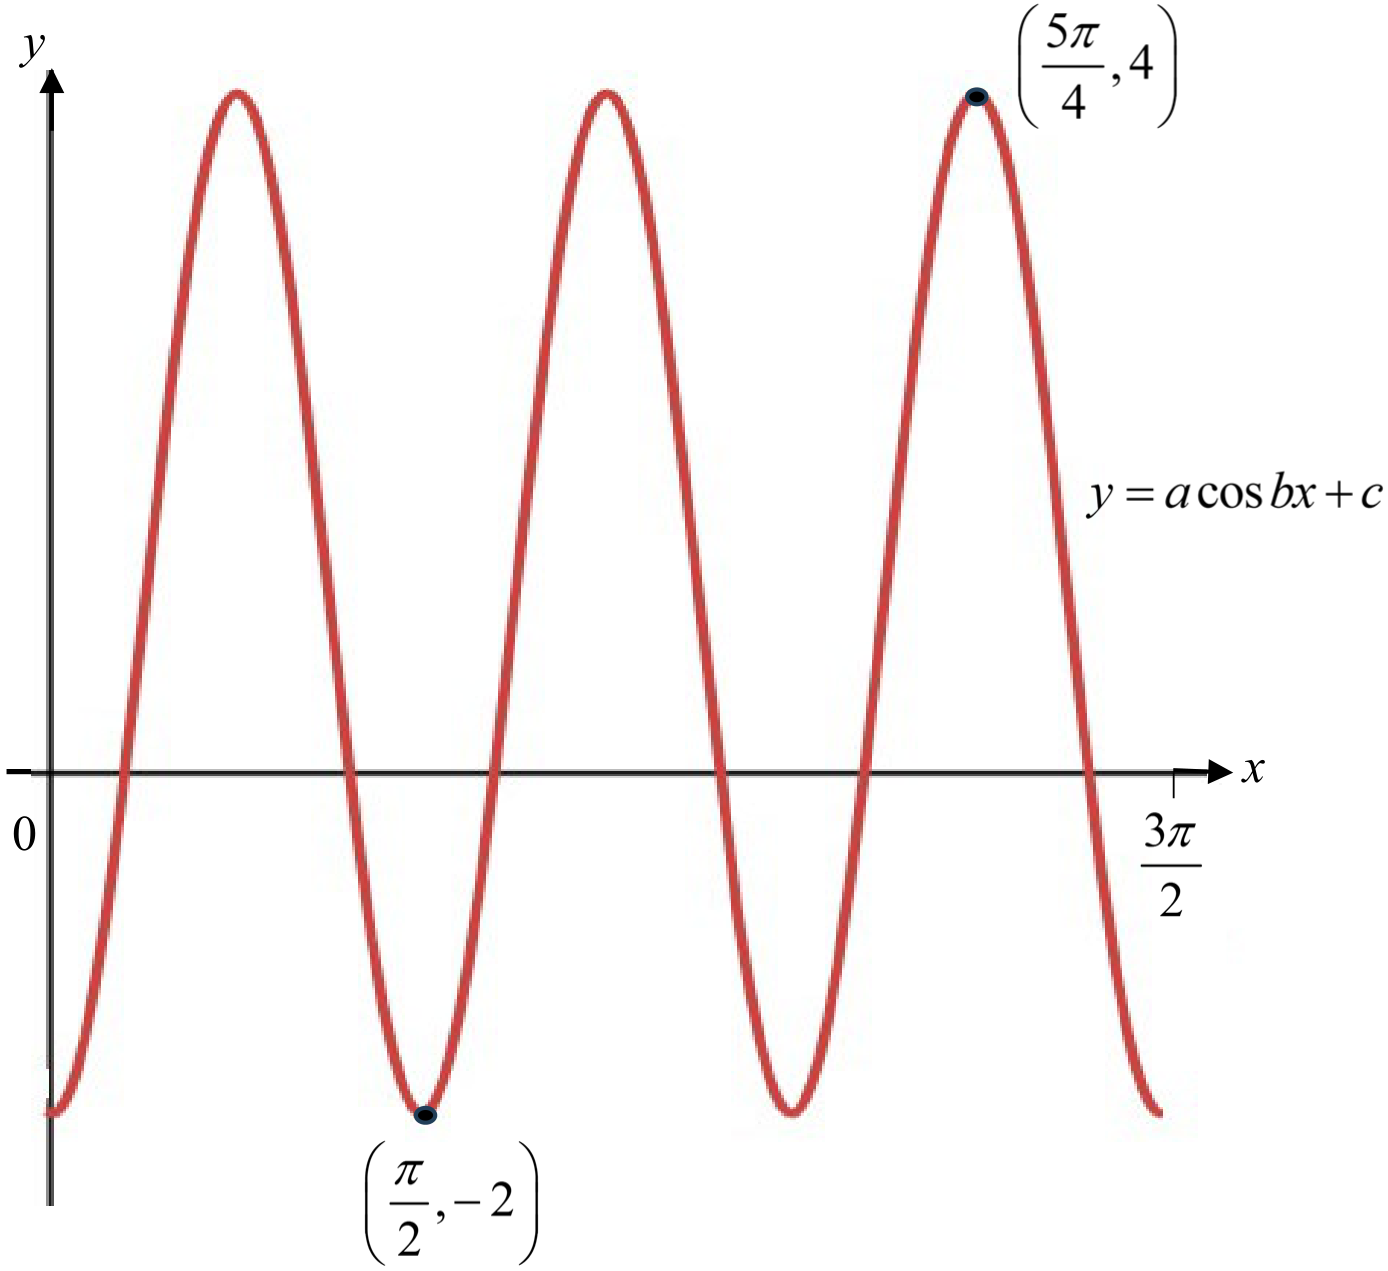
The diagram shows the curve for radians. A minimum point and a maximum point are indicated on the diagram.
Explain why .
Explain why .
Hence find the equation of the curve.
Show worked solution▾
(a)
(b)
is the axis of curve
(c)
By observation, . Equation of curve is .
Trigonometric Graphs
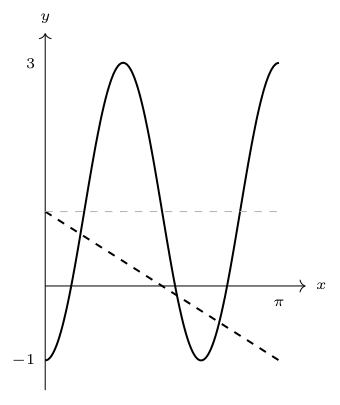
Sketch the graphs of and on the same axes, for .
Explain how the number of solutions for can be found using the graphs.
Show worked solution▾
(a)
(b)
The is equivalent to and so its solutions can be found from the interception points of the two graphs.
Trigonometric Graphs
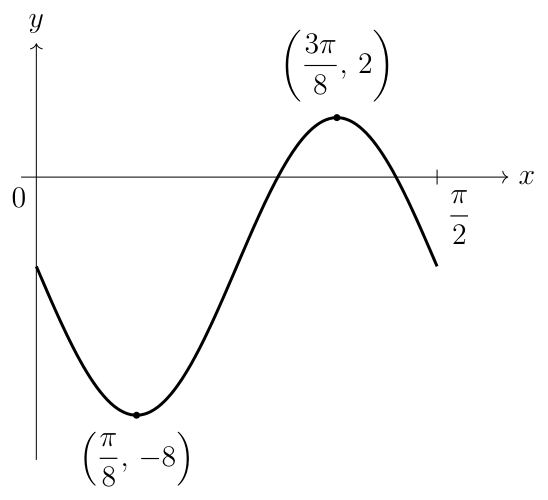
The diagram shows the curve for radians. The curve has a minimum point at and a maximum point at .
Explain why .
Explain why .
Hence find the equation of the curve.
Show worked solution▾
(a)
is axis of curve
(b)
(c)
Since this is a negative sine graph and the amplitude is 5, .
The equation of the curve is .
Trigonometric Graphs
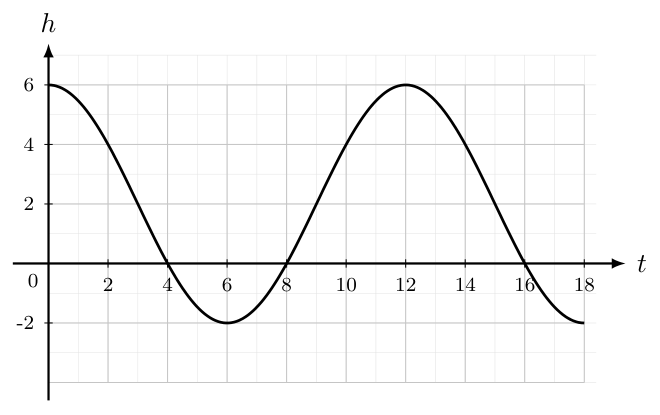
A waterwheel rotates at 1 revolution per 12 seconds. Initially, Point , marked on the highest point of the rim of the wheel is 6 m above the water surface. It reaches 2 m below the water surface 6 seconds later.
The motion of point can be modelled using the trigonometric equation , where the height of point above the water surface, , is a function of time , in seconds.
Show that and .
On the axes below, sketch the graph of , for .
A similar waterwheel at a different location has a point, , marked on its rim. The motion of point is modelled by the equation .
By drawing a suitable straight line on the same axes above, determine the number of time(s) when point touches the water surface from .
Show worked solution▾
(a)
(b)
(c)
2 times
Trigonometric Graphs
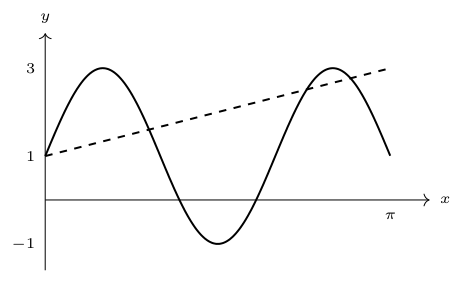
State the amplitude and period of .
Sketch the graph of for .
By drawing a suitable straight line on your sketch, determine the number of solutions of the equation .
Show worked solution▾
(a)
(b)
for :
(c)
Draw .
Number of solutions .
Trigonometric Graphs
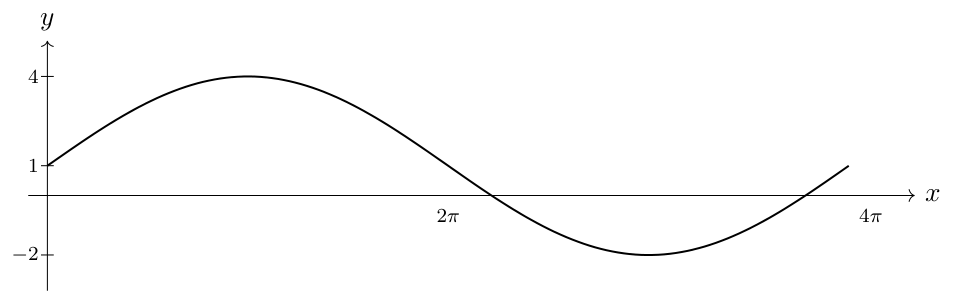
State the amplitude and period of the graph of .
Sketch the graph of for .
By adding another suitable curve on your sketch, determine the number of solutions of the equation .
Show worked solution▾
(a)
Amplitude
Period or
(b)
(c)
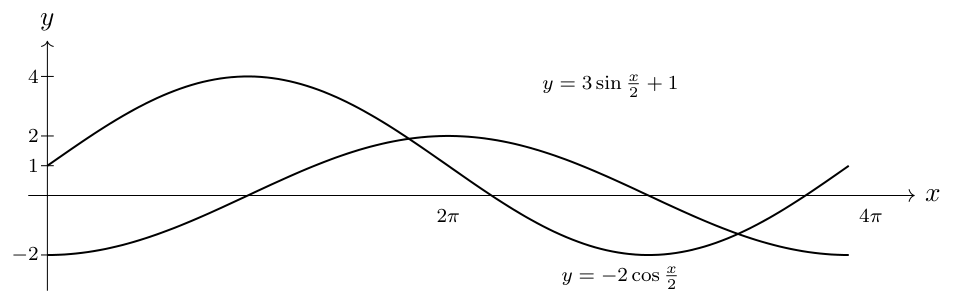
Sketch
Number of solutions
Trigonometric Graphs
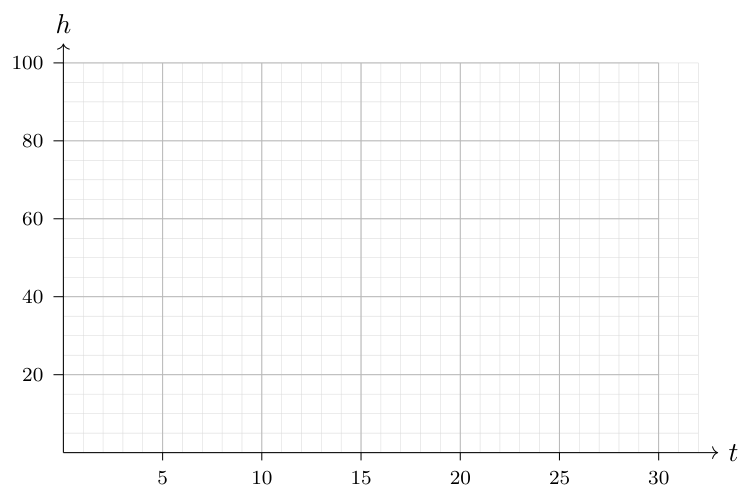
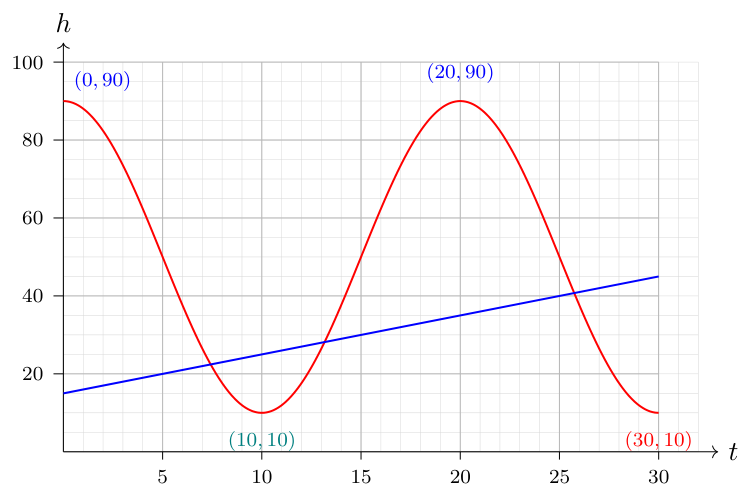
The maximum height that a roller coaster can reach is 90 meters above sea level, and the lowest possible height is 10 meters above sea level. The roller coaster takes 10 seconds to move from its highest position to its lowest position. The height, m, of the roller coaster above sea level can be modelled by the function , where is the time in seconds.
Show that .
Sketch the graph of for .
Find the time when the roller coaster first reaches a height of 62 m.
On your graph in part (b), draw the graph of .
State for the interval , the number of solutions of .
Show worked solution▾
(a)
Max
Min
(b)
(d)
(c)
(d)
(ii) solutions