
Hypothesis Testing: Two-stage hypothesis test — EJC 2025 H2 Math Prelim Paper 2
What this question tests
Question
The students in Eunoia Junior College (EJC) have been complaining of long queue times at the canteen during peak hours. It was claimed that the average queue time per student is 20 minutes. It is known that the standard deviation of the queue times is 3.8 minutes.
The admin manager of EJC wishes to test if the average queue time is in fact 20 minutes. She examines a random sample of 15 students to determine the average queue time.
- State what it means for a sample to be random in this context.
- Given that the admin manager concludes that there is no reason to reject the null hypothesis at the 5% level of significance, find the range of possible values of the sample mean, and state an assumption needed for your calculations.
To reduce the queue time, a lunch pre-order system, EuOrder, was introduced. The admin manager is tasked to find out if there is any improvement to the average queue time per student. She obtained a random sample of 50 students and recorded their queue times, \(t\) minutes, on a particular day. The results are summarised as follows: \[ \sum(t - 20) = -35, \qquad \sum(t - 20)^2 = 489. \]
- Find unbiased estimates of the population mean and variance.
- Test, at the 10% level of significance, the claim that EuOrder has reduced the average queue time at the canteen.
Show full worked solution▾
(a) A sample is random in this context if every student has an equal probability of being selected, and the selection of any one student is independent of the selection of every other student.
A random sample means every student has an equal probability of being chosen, and the selections are independent of one another.
(b) Let \(X\) be the queue time of a randomly chosen EJC student during peak hours, with population mean \(\mu\).
Hypotheses: \(\quad H_0: \mu = 20 \qquad H_1: \mu \neq 20\) (two-tailed test at \(5\%\)).
Assumption: the queue times are normally distributed (necessary since \(n = 15\) is small and \(\sigma\) is given).
Under \(H_0\): \[ \bar{X} \sim \mathrm{N}\!\left(20,\, \frac{3.8^2}{15}\right). \]
The two-tailed critical region at the \(5\%\) level is \(\{\bar{x} : |\bar{x} - 20| \ge z_{0.025}\cdot \tfrac{3.8}{\sqrt{15}}\}\). The acceptance region (where \(H_0\) is not rejected) is:
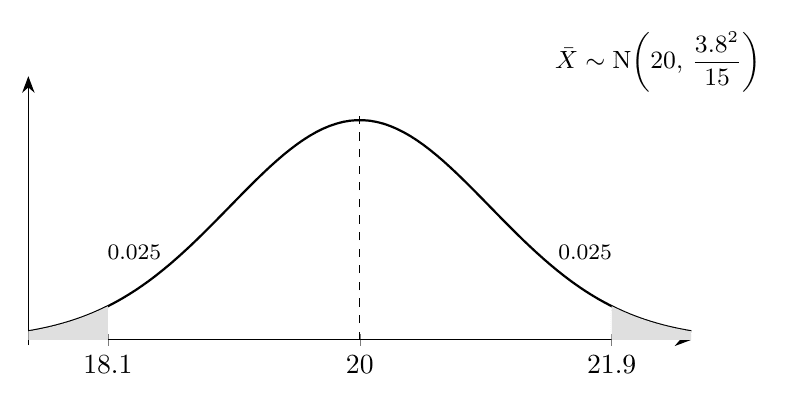
Given \(H_0\) is not rejected at the \(5\%\) level, the sample mean must lie in the acceptance region: \[ 18.1 < \bar{x} < 21.9 \quad (\text{3 s.f.}). \]
\(18.1 < \bar{x} < 21.9\). Assumption: the queue times are normally distributed.
(c) Unbiased estimates from the new sample of \(n = 50\): \[\begin{aligned} \bar{t} &= \frac{\sum(t - 20)}{50} + 20 = \frac{-35}{50} + 20 = 19.3,\\[3pt] s^2 &= \frac{1}{n-1}\!\left[\sum(t-20)^2 - \frac{\left(\sum(t-20)\right)^2}{n}\right] = \frac{1}{49}\!\left[489 - \frac{(-35)^2}{50}\right] = \frac{929}{98} \approx 9.48\ (\text{3 s.f.}). \end{aligned}\]
\(\bar{t} = 19.3\), \(\quad s^2 = \dfrac{929}{98} \approx 9.48\).
(d) Let \(\mu\) be the population mean queue time after EuOrder.
Hypotheses: \(\quad H_0: \mu = 20 \qquad H_1: \mu < 20\) (left-tailed test at \(10\%\)).
Since \(n = 50\) is large, by the Central Limit Theorem, \[ \bar{T} \sim \mathrm{N}\!\left(20,\, \frac{9.4796}{50}\right) \text{ approximately under } H_0. \]
Critical-value method: the left-tail critical value is \(z_{0.10} = -1.2816\), giving critical region \[ \bar{t} < 20 - 1.2816 \sqrt{\frac{9.4796}{50}} = 19.442. \]
From the data, \(\bar{t} = 19.3 < 19.442\), so \(\bar{t}\) lies in the critical region. Hence we reject \(H_0\) at the \(10\%\) level.
Conclusion: there is sufficient evidence at the \(10\%\) level of significance to conclude that EuOrder has reduced the average queue time at the canteen.