Free practice / Secondary 4 E Maths
Sec 4 E Maths: Graphs of Functions, practice questions & worked solutions
Graphs of functions questions selected from 2023 to 2025 Singapore school E Maths prelim papers, each with the school’s full worked solution.
About this topic & key methods
Graphs in Sec 3 and Sec 4 E Maths cover quadratic, cubic, reciprocal and exponential curves, graphs in real situations such as speed-time graphs, and solving equations with a plotted curve. Most questions here are short Paper 1 items, with two Paper 2 questions that ask you to plot a curve, draw a tangent and add a straight line.
Attempt each question on paper before opening its worked solution. The solutions are the schools’ own marking schemes, so some steps are brief.
Key methods for graphs of functions
- Complete the square: has turning point and line of symmetry
- For the curve cuts the -axis at and , opens downwards and turns at
- For , the -intercept gives ; substitute a second point to find
- Know the shapes of , , , and , and how adding a constant shifts them
- On a speed-time graph, the gradient is the acceleration and the area underneath is the distance travelled
- To solve an equation with a plotted curve, rearrange it so one side is the curve's equation; the other side is the line to draw
- For the gradient of a curve, draw a tangent at the point and use two points far apart on it
For lessons that build these methods week by week, see our E Maths tuition for Sec 3 and Sec 4.
Graphs of Functions questions with worked solutions
Unless the question specifies otherwise, give non-exact answers to 3 significant figures and angles in degrees to 1 decimal place.
Finding the constants of an exponential graph, Dunman Secondary School, 2025 Prelim P1 Q19
The sketch shows the graph of , where .
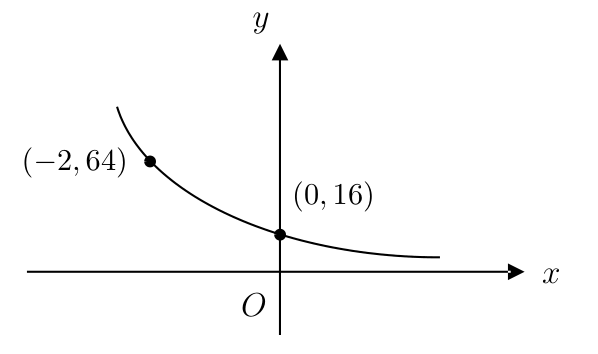
Find the values of and . [2]
Show worked solution▾
Answer:
Sketching a quadratic from its factorised form, Tanjong Katong Girls’ School, 2025 Prelim P1 Q16
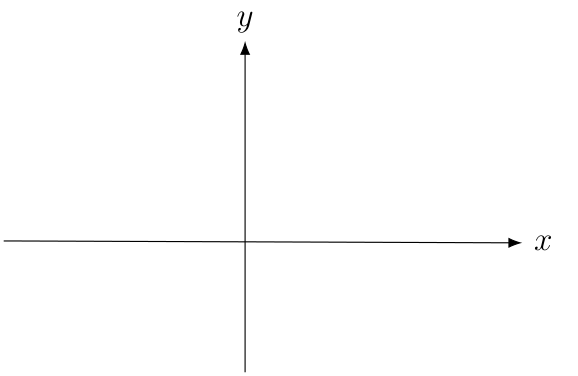
Sketch the graph on the axes below. Indicate clearly the equation of the line of symmetry, the coordinates of the turning point and the points where the graph crosses the axes. [3]
Show worked solution▾
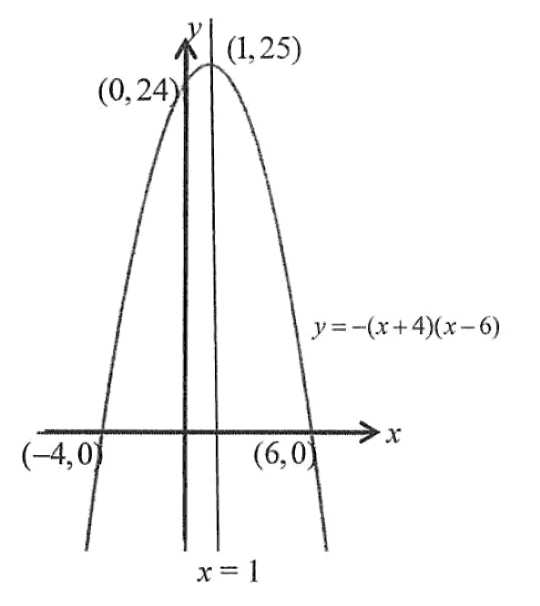
Eqn of line of symmetry .
Coordinates of the turning point ,
-intercepts ,
and -intercept .
Answer:
Completing the square to find the turning point, Methodist Girls’ School, 2025 Prelim P1 Q12
Express in the form of . [2]
The curve is drawn.
Using your answer in (a), write down
the coordinates of the turning point, [1]
the equation of the line of symmetry of the curve. [1]
Show worked solution▾
(a)
(b)
(i)
(ii)
Answer: (a) (b)(i) (ii)
Matching equations to graph shapes, Fairfield Methodist School (Secondary), 2023 Prelim P1 Q15
Write down a possible equation for each of the graph below.
In each case, select one of the equations from the table below.

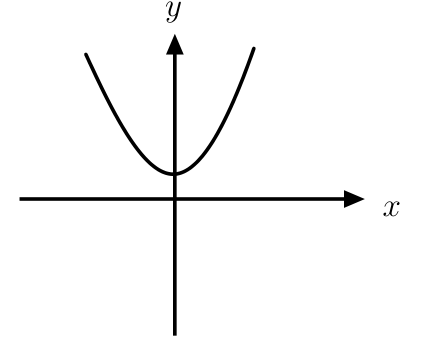
[1]
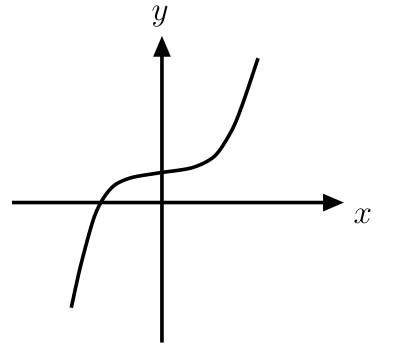
[1]
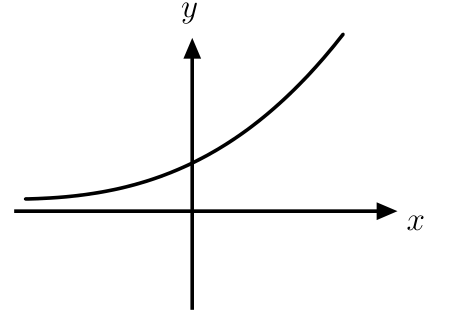
[1]
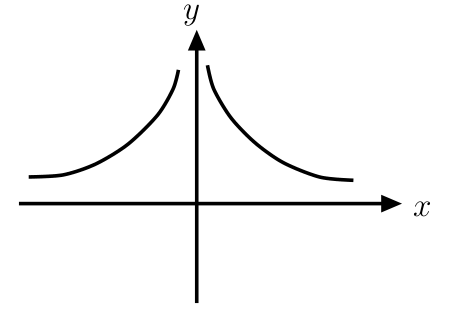
[1]
Show worked solution▾
(a)
(b)
(c)
(d)
Answer: (a) (b) (c) (d)
Quadratic equation from the line of symmetry, Anglo-Chinese School (Independent), 2024 Prelim P1 Q5
Part of the graph of a quadratic function is shown below.
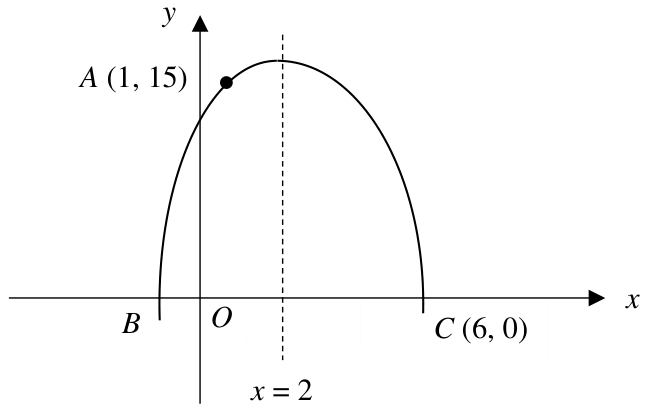
The graph passes through the point and it cuts the -axis at the points and .
Given that is and is the line of symmetry of the graph,
write down the equation of the quadratic curve in the form . [2]
find the positive value of when , leaving your answer in exact form. [1]
Show worked solution▾
(a)
Substitute into eq to find :
Find maximum coordinate: when , . Equation: .
(b)
or (positive value).
Answer: (a) (b)
Overtaking on a speed time graph, Bukit Merah Secondary School, 2025 Prelim P1 Q19
The diagram below shows Car travelling at a uniform speed of 60 m/s.
Car accelerated uniformly from rest to reach a speed of 80 m/s in 10s and continued travelling at the same speed thereafter.
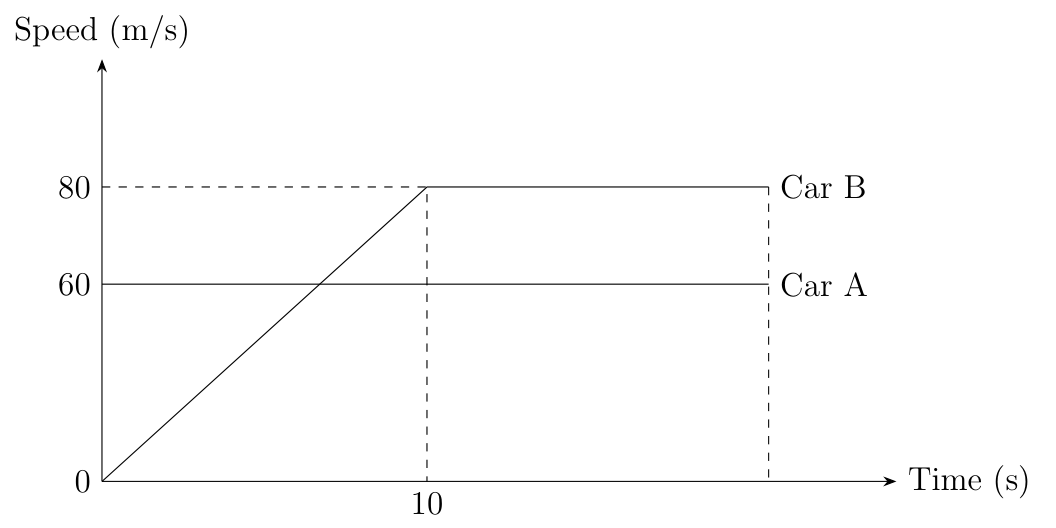
Find the acceleration of Car from 0 to 10s. [1]
Find the time when both cars were travelling at the same speed. [2]
Find the time when Car overtook Car . [2]
Show worked solution▾
(a)
(b)
Let be the time when both cars were travelling at the same speed.
(c)
Let be the time when Car overtook Car .
Answer:
Minimum value from the completed square form, Ngee Ann Secondary School, 2025 Prelim P1 Q18
Explain why has its minimum value when . [1]
The roots of the equation are and 4.
Explain why the value of is 1. [1]
Find the minimum value of . [1]
Sketch the graph of on the axes below.
Indicate clearly the coordinates where the graph crosses the -axis and the minimum point on the curve.
[2]
Show worked solution▾
(a)
When , and .
When , and .
So, has its minimum value of when .
(b)
Since the graph of is symmetric about the vertical line passing through its minimum point,
(c)
Sub , , ,
Min. value of is .
(d)
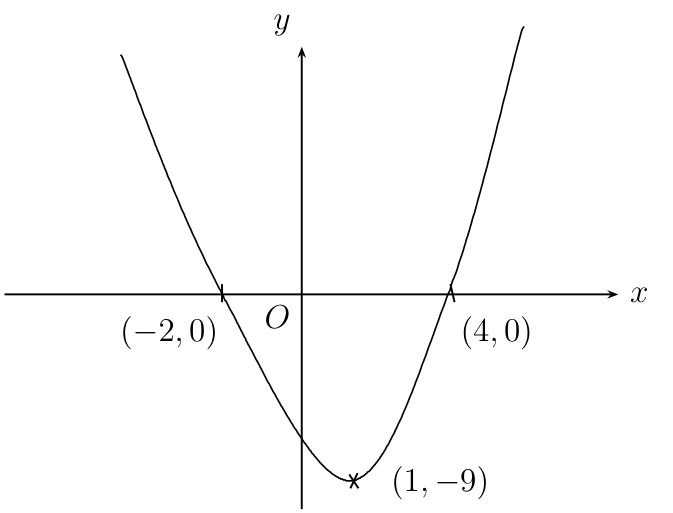
Answer: (a) , so , with only when (b) the line of symmetry is midway between the roots, (c) (d) U-shaped curve crossing the -axis at and , minimum point
Acceleration and distance from a speed time graph, CHIJ St. Nicholas Girls’ School, 2023 Prelim P1 Q22
The diagram shows the speed-time graph of a car journey.
The car accelerates for 10 seconds reaching a speed of 12 m/s. It then accelerates for another 12 seconds and then travels at a constant speed of 20 m/s.
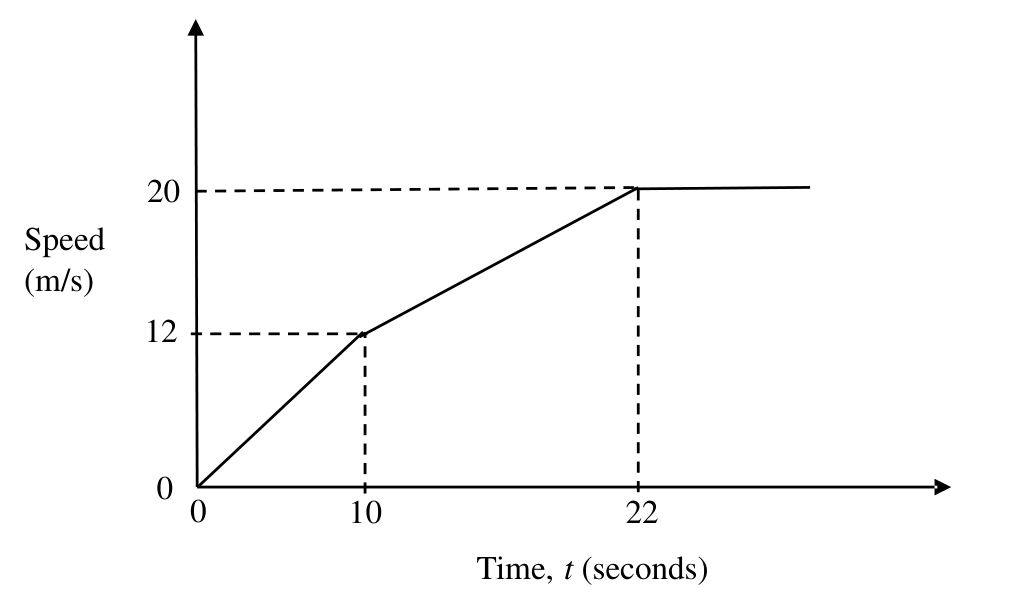
Calculate the speed of the car when . [2]
Calculate the distance travelled in the first 22 seconds. [2]
A motor cyclist starts 13 seconds later from the same place as the car, and accelerates uniformly for 9 seconds until it reaches a speed of 25 m/s.
Is the motor cyclist behind the car at ?
Justify your decision. [2]
Show worked solution▾
(a)
(b)
(c)
distance by car m
distance by motor cyclist
distance by motor cyclist m m
motor cyclist is behind the car at t
Answer: (a) 14 m/s (b) 252 m (c) 112.5 m 252 m, behind the car
Solving cubic equations by drawing a straight line, Swiss Cottage Secondary School, 2024 Prelim P1 Q24
The graphs of and are drawn on the grid.
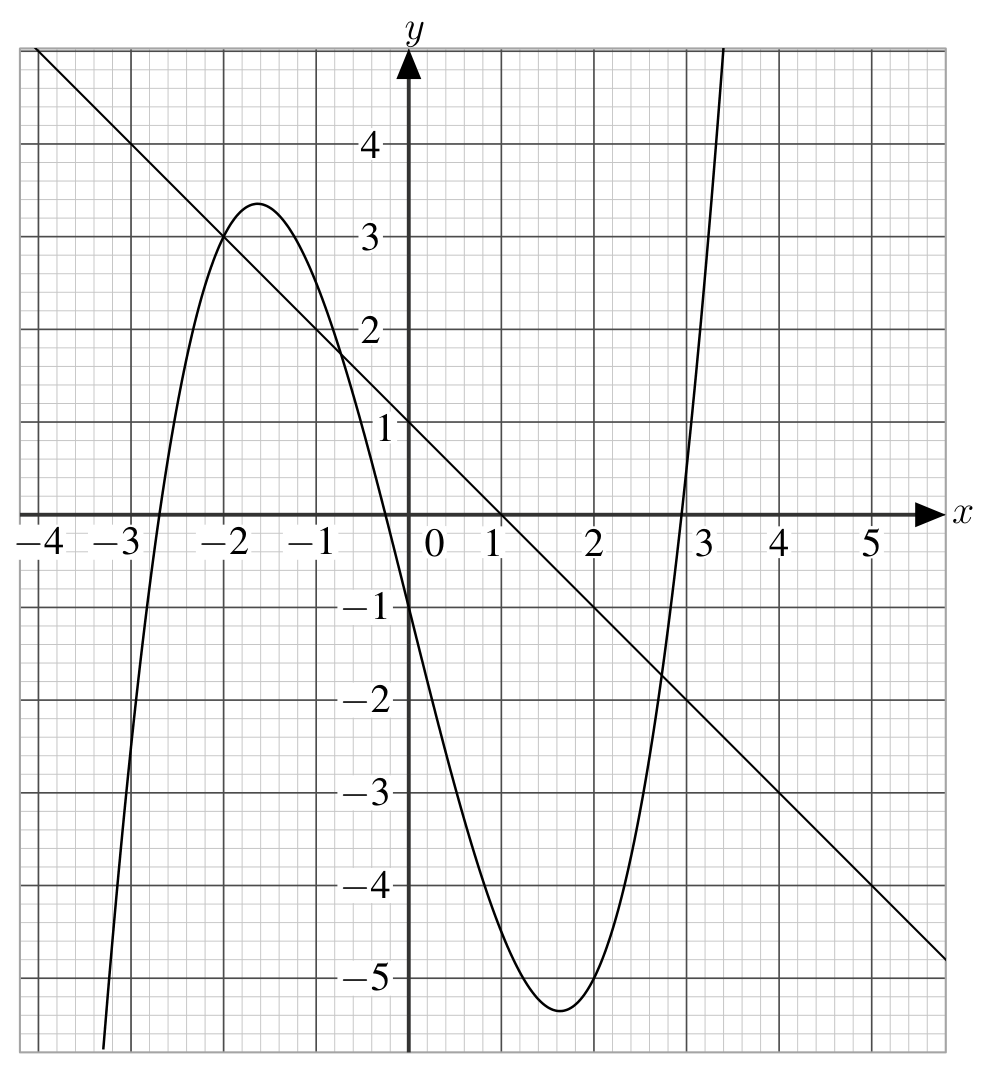
The points of intersection of the curve and the straight line give the solutions of a cubic equation. Find the cubic equation, giving your answer in the form , where , , and are integers. [1]
By drawing a tangent, find the gradient of the curve at . [2]
The equation can be solved by drawing a suitable straight line on the grid.
Find the equation of the straight line. [1]
By drawing this straight line, solve the equation . [2]
Show worked solution▾
(a)
(b)
Draw tangent
Gradient
(c)(i)
Equation of line:
(c)(ii)
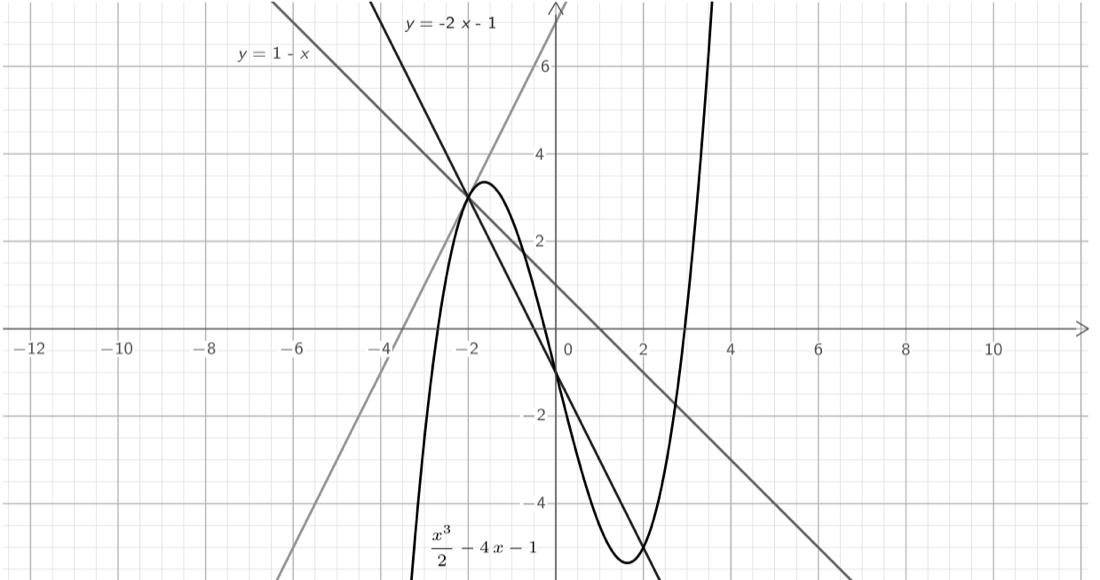
Draw
Answer: (a) (b) (c)(i) (ii)
Speed time and distance time graphs with clock times, Broadrick Secondary School, 2024 Prelim P1 Q26
The diagrams show the speed-time graph and the corresponding distance-time graph of a car.
The car travelled from a point to and in the journey, its greatest speed attained was 1.5 km/min.
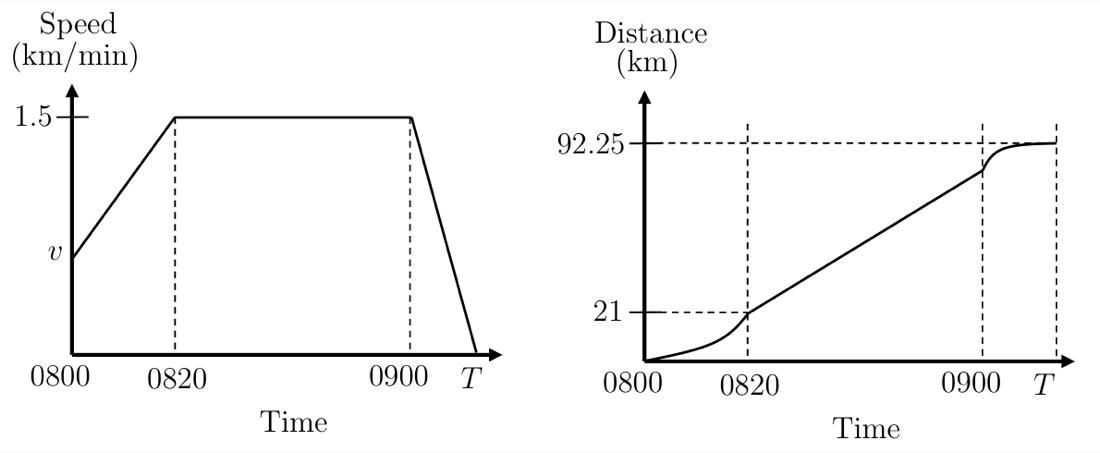
Convert 1.5 km/min to m/s. [1]
Show that , the initial speed, was 0.6 km/min. [2]
Find the speed of the car, in m/s, at 0812. [2]
The total distance travelled by the car is 92.25 km.
Find the time, , when it comes to a complete stop. [2]
Show worked solution▾
(a)
1.5 km/min
m/s
(b)
Area = dist travelled
(c)
m/s
OR
(d)
Area = dist travelled
is 0915
Answer: (a) m/s (c) m/s (d) is 0915
Exponential growth graph and the gradient as a rate, Anglo-Chinese School (Barker Road), 2023 Prelim P2 Q3
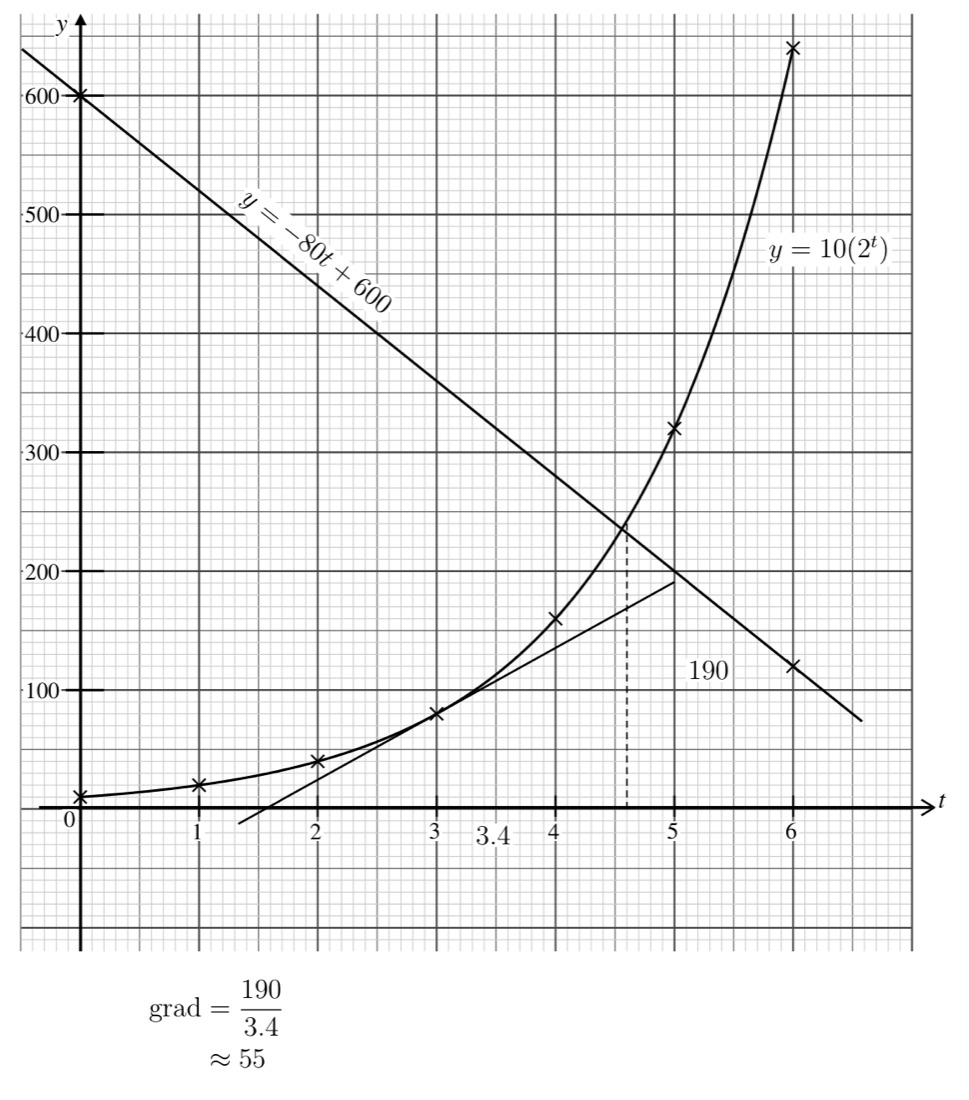
The number of micro-organisms, , in a test tube after days is shown in the table below. The relationship between and can be modelled by the equation .
Find the value of . [1]

On the grid opposite, draw the graph of for . [3]
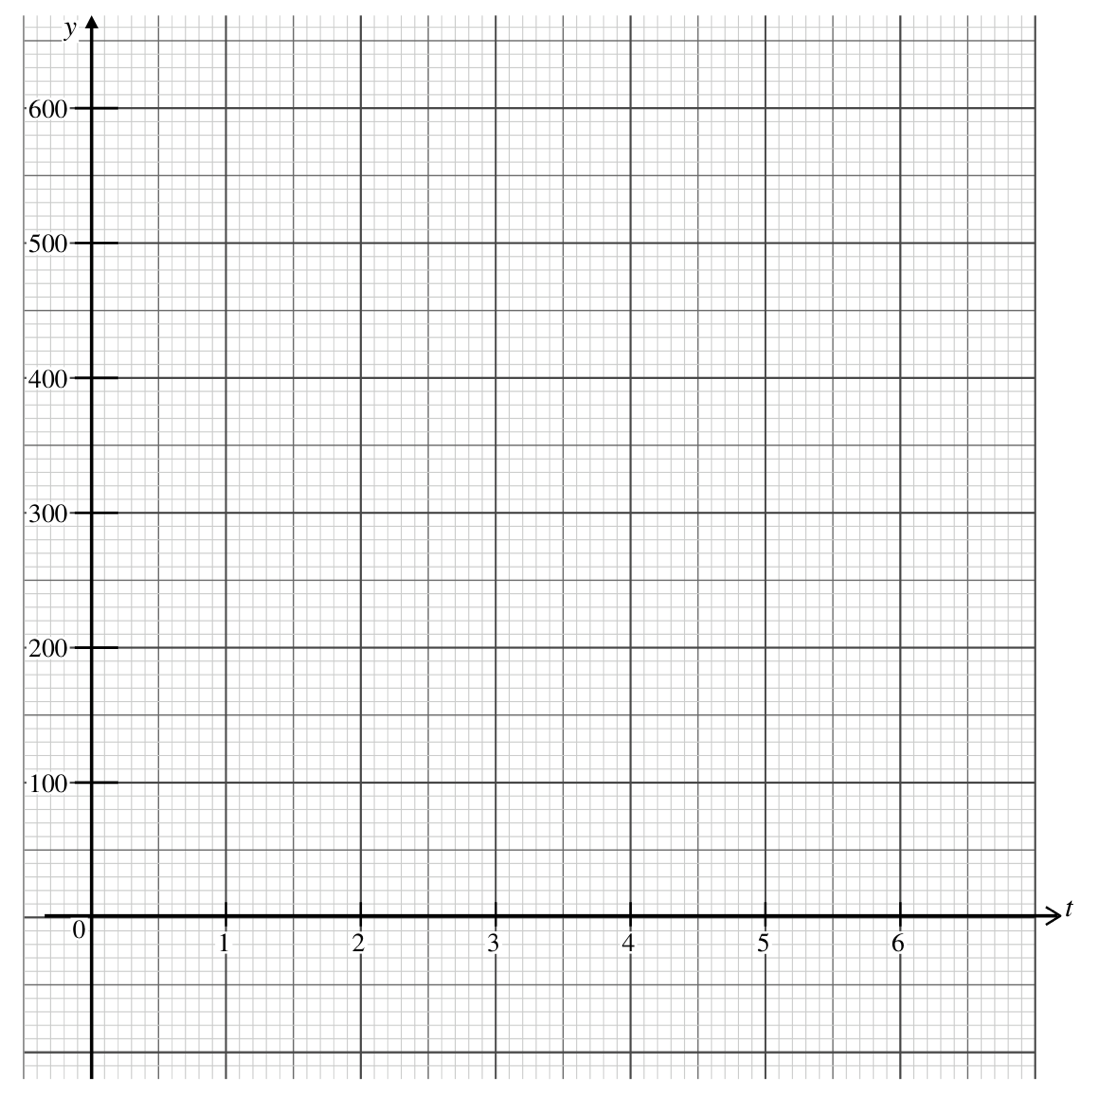
By drawing a tangent, find the gradient of the curve when . [2]
What does this gradient represent? [1]
The number of micro-organisms in another test tube is given by the equation
.
By drawing the line , find the number of days for the number of micro-organisms in the two test tubes to be the same. [2]
Show worked solution▾
(a)
(b)
All 7 points plotted
Smooth curve through plotted points.
(c)(i)
Drawing of tangent at
(c)(ii)
The micro organisms are increasing at rate of 55.5 per day after 3 days.
(d)
Drawing of line
Answer: (a) (c)(i) about (ii) the rate at which the number of micro-organisms is increasing when , about per day (d) days
Plotting a reciprocal curve, tangent and line intersections, Greenridge Secondary School, 2024 Prelim P2 Q7
Complete the table of values for .
Values are given to 1 decimal place where appropriate.
[1]
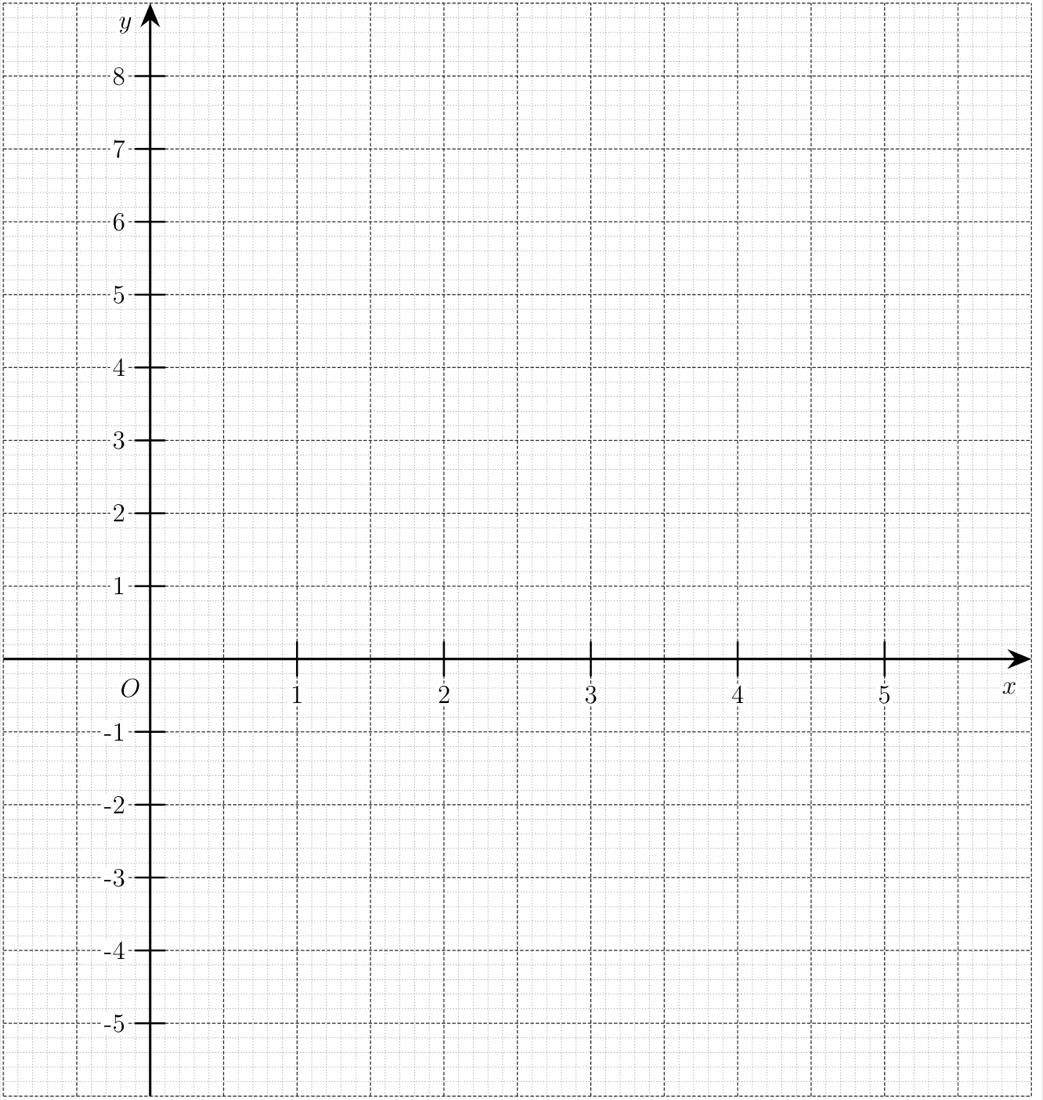
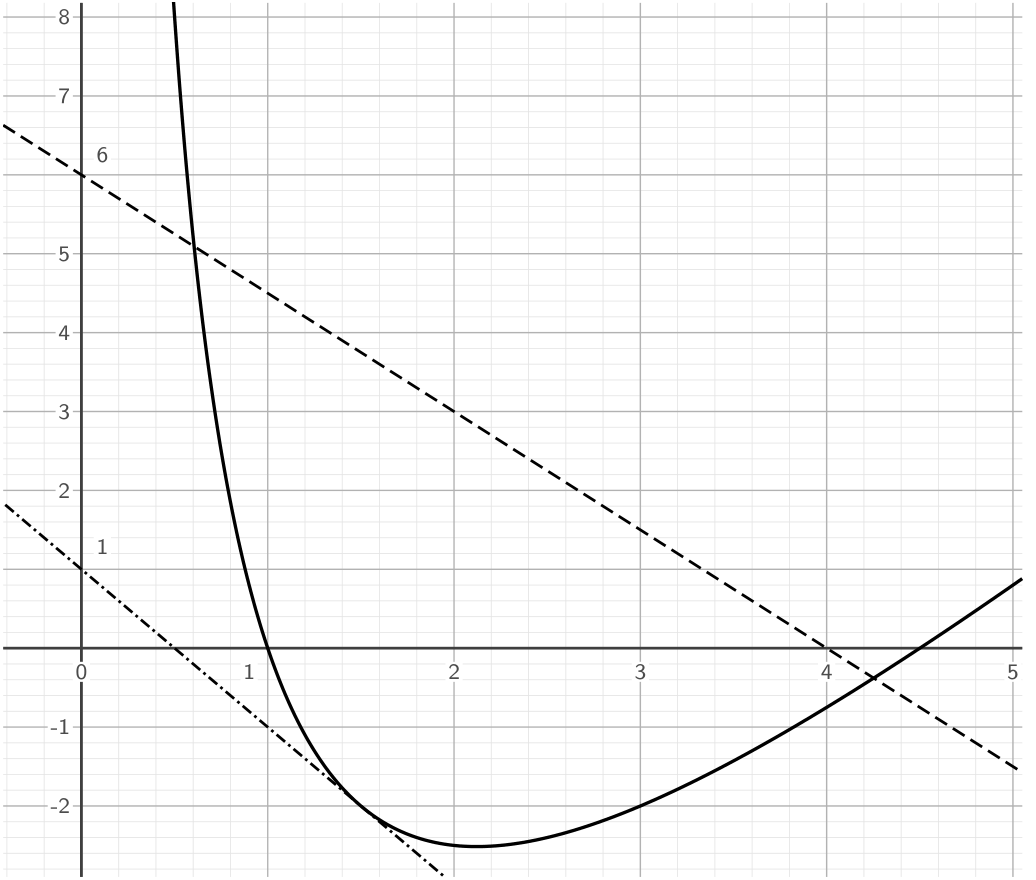
On the grid, draw the graph of for .
[3]
By drawing a tangent, find the gradient of the curve at . [2]
On the same axes, draw the graph of the straight line . [1]
Write down the -coordinates of the points where the graphs meet. [2]
These values of are the solutions of the equation .
Find the value of and value of . [2]
Show worked solution▾
(a)
(b)
(c)
Tangent drawn correctly
(d)(i)
Straight line passing through and
(d)(ii)
,
(d)(iii)
Answer: (a) (c) (d)(ii) (d)(iii)
More practice related to graphs of functions
Sec 2 Maths: Linear and Quadratic Graphs
Sec 1 Maths: Functions and Linear Graphs
Sec 4 E Maths: Quadratic Equations and Completing the Square