
Sec 2 Maths: Linear & Quadratic Graphs, practice questions & worked solutions
Linear and quadratic graph questions from 2025 Singapore Secondary 2 End-of-Year examination papers. They cover the gradient and equation of a straight line, intercepts and the line of symmetry of a parabola, and plotting quadratic graphs from a table of values to read off maximum points and solutions, and every question has a full step-by-step worked solution.
About this topic & key methods
In Secondary 2 Mathematics, graphs connect algebra to pictures. A linear graph is a straight line with gradient and -intercept . A quadratic graph is a parabola: it opens upwards with a minimum point when , and downwards with a maximum point when . Every parabola has a vertical line of symmetry through its turning point.
The questions below start with straight lines, move on to reading intercepts and the line of symmetry of a sketched parabola, then ask you to complete a table of values, plot the curve, draw a straight line on the same grid and read off where they meet. The last group sets the curve in a real context: a ball, an arrow, a bird in a game and a garden. For a structured programme covering this topic, see our Sec 2 Maths tuition.
Key methods
- Gradient: ; the equation of the line is , where is the -intercept.
- Intercepts: put to find where a graph cuts the -axis, and to find where it cuts the -axis.
- Line of symmetry: for a parabola it is the vertical line halfway between the two -intercepts, or halfway between any two points with the same -value.
- Table of values: substitute each carefully, with brackets around negative values, e.g. .
- Plotting: plot every point from the table and join them with one smooth curve, not straight segments; label the graph.
- Reading a graph: draw a horizontal or vertical line to the curve and read the other coordinate; the -coordinates where a line meets the curve solve the equation formed by setting the two expressions equal.
Questions & worked solutions
Table of values and plotting a straight line
Complete the table of values for the linear function .
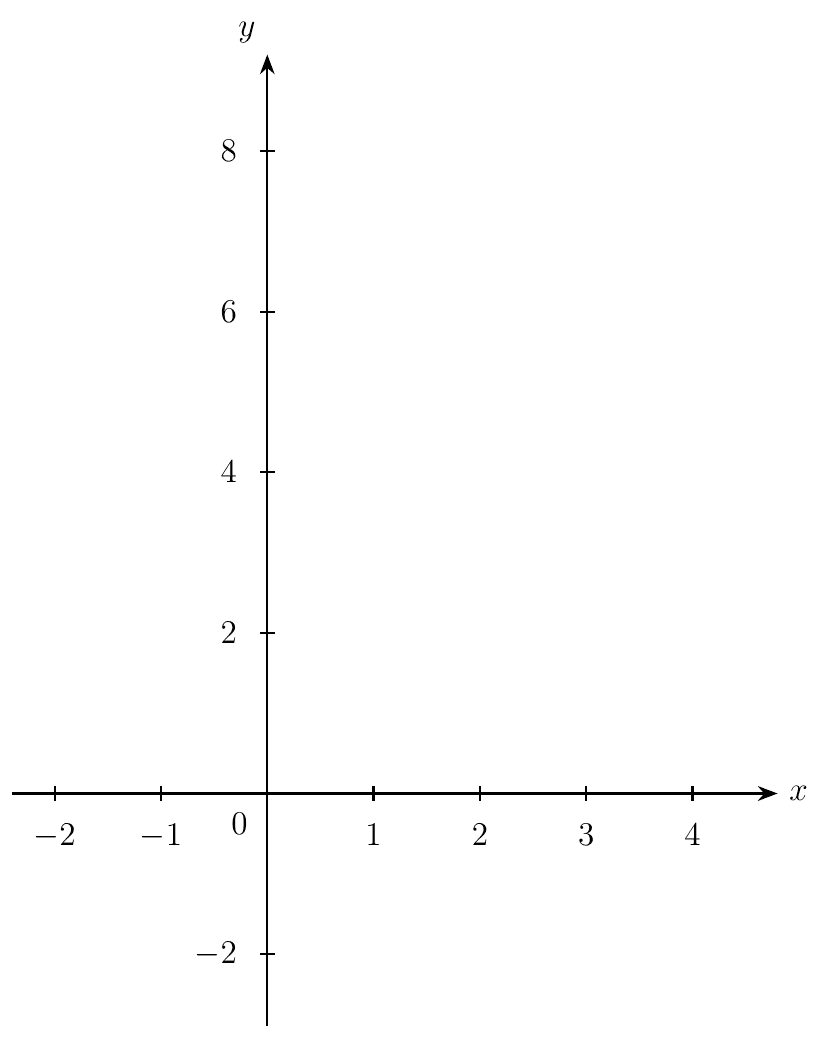
Plot the graph of on the grid below and label the line.
Show worked solution▾
(a)
Substitute :
(b)
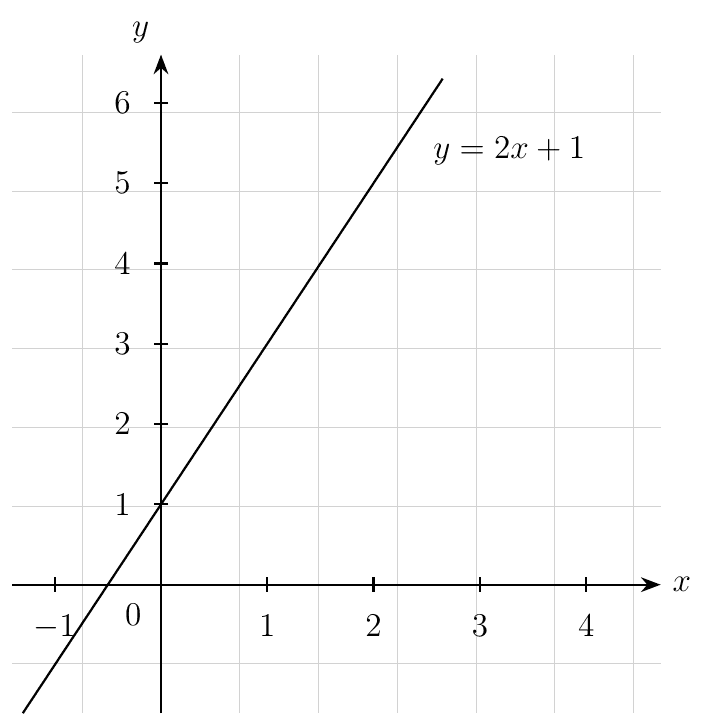
Plot the four points , , and , join them with a ruler into one straight line, and label it . The line crosses the -axis at and rises units for every unit across.
Gradient and equation of a straight line
The line passes through the point and .
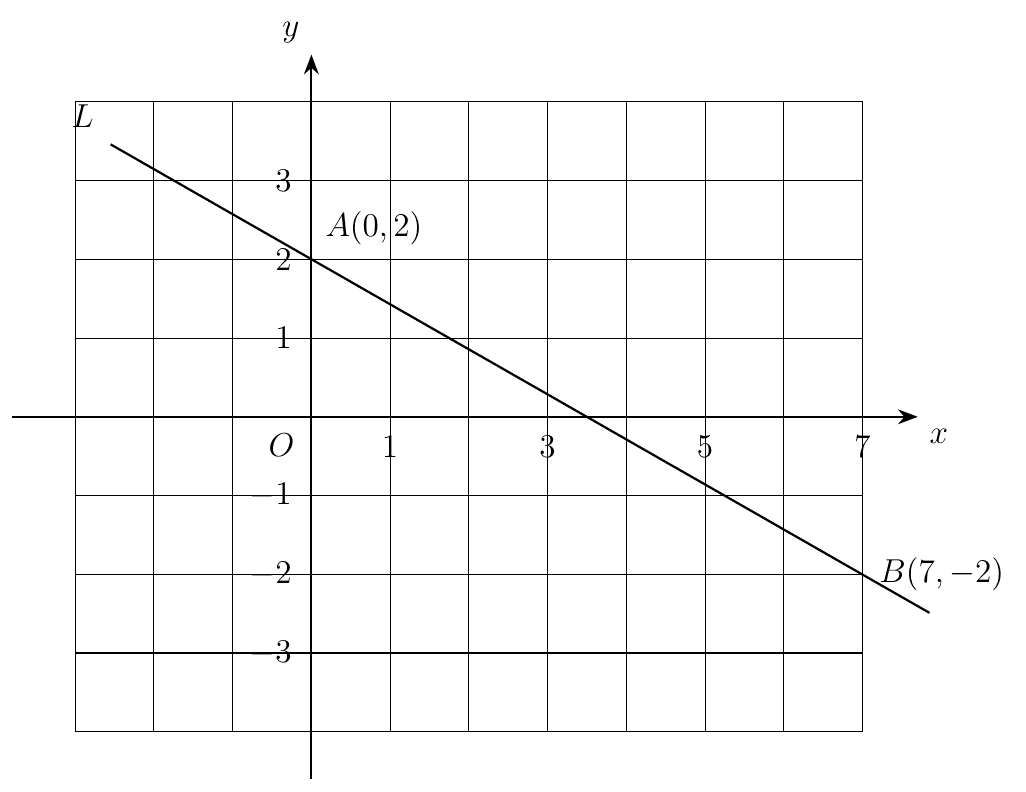
Find the gradient of the line .
Write down the equation of line .
Show worked solution▾
(a)
(b)
The line passes through , so the -intercept is . Using :
This can also be written as .
Intersection of two lines and the area of a triangle
In the diagram, the equation of line is and the equation of line is . Line and line intersect at point .
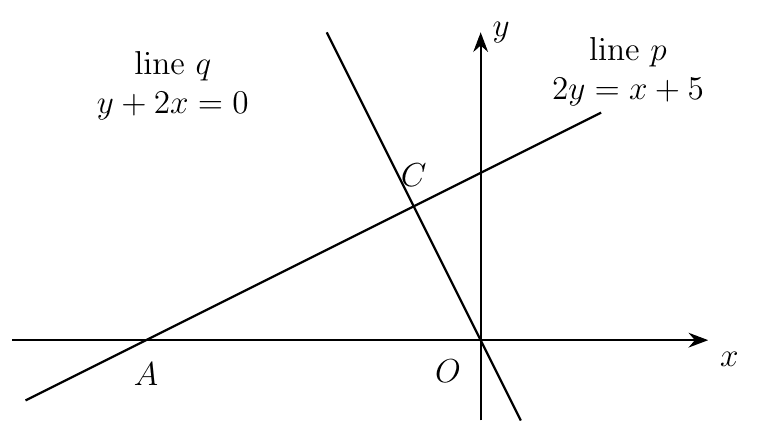
By solving the simultaneous equations and , show that the coordinates of is .
It is also given that line intersects the -axis at point and line passes through . Calculate the area of triangle .
Show worked solution▾
(a)
From line , . Substitute into :
So is (shown).
(b)
At , on line :
So units along the -axis. The height of triangle above is the -coordinate of , which is :
Intercepts and line of symmetry of a parabola
The graph of is given below.
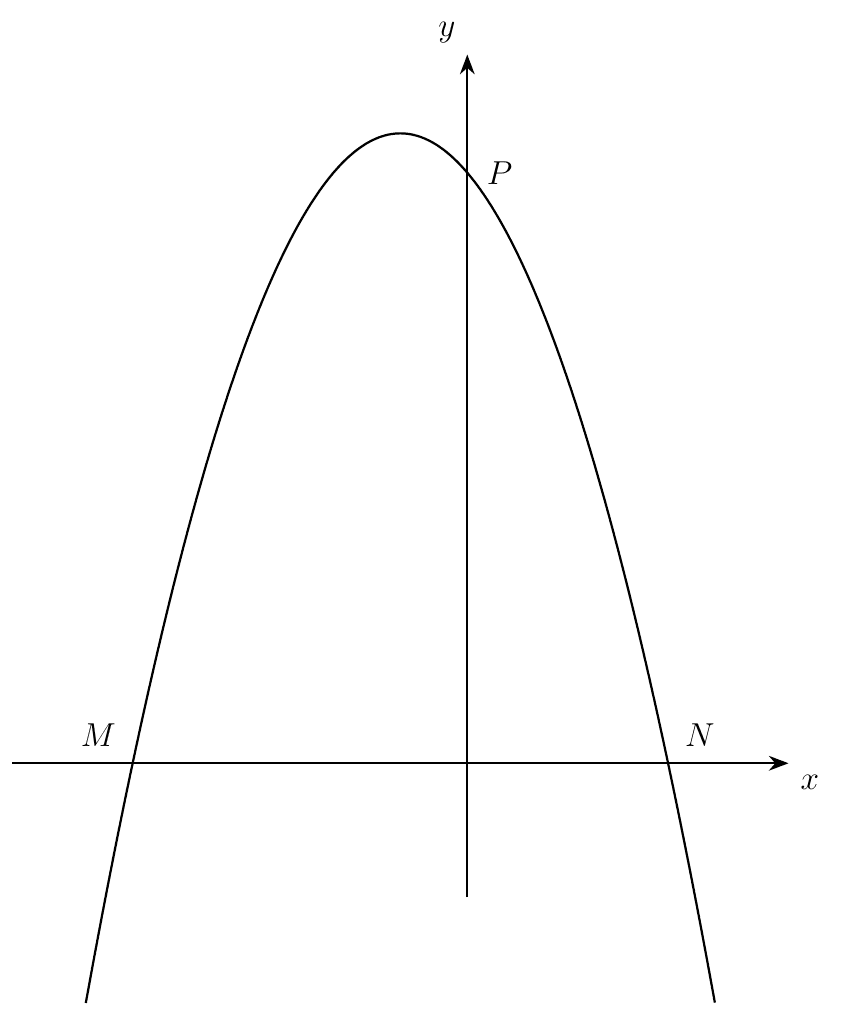
State the values of the two -intercepts.
Write down the coordinates of .
Find the equation of the line of symmetry of the graph.
Show worked solution▾
(a)
At the -intercepts, :
(b)
is where the curve cuts the -axis, so put :
is .
(c)
The line of symmetry is halfway between the -intercepts:
The line of symmetry is .
Intercepts, line of symmetry and minimum value
In the diagram, the curve cuts the -axis at two points and , and the -axis at point .
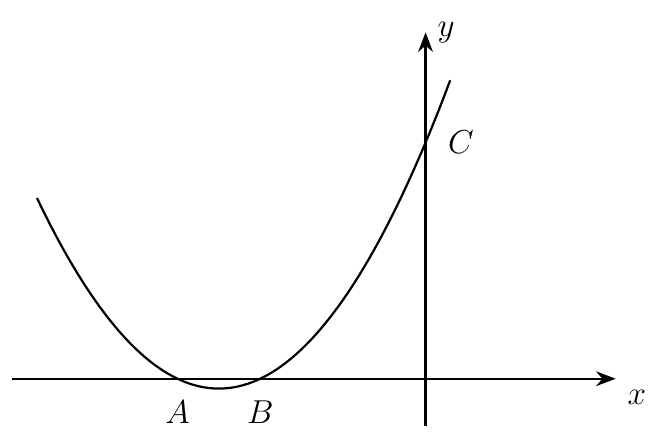
Calculate the coordinates of , and .
Write down the line of symmetry of the curve.
Jane claims that the minimum -value of the curve is . Do you agree with her? Show your working clearly.
Show worked solution▾
(a)
For and , put and factorise:
is further from the origin, so and .
For , put : , so .
(b)
The line of symmetry is .
(c)
The minimum point lies on the line of symmetry, so substitute :
I do not agree with Jane. The minimum -value is , not .
Plotting a quadratic graph and a line on the same grid
The variables and are connected by the equation . Some corresponding values of and are given in the following table
Find the value of .
Using a scale of 2 cm to represent 1 unit on the -axis and 2 cm to represent 1 unit on the -axes, draw the graph of for .
Use your graph.
write down the equation of the line of symmetry.
find the value of when .
On the graph, draw the line . Write down the -coordinates of the points where this line intersects the graph .
Show worked solution▾
(a)
(b)
Draw the -axis from to and the -axis from to , with 2 cm for each unit on both axes. Plot the seven points from the completed table:
Join them with one smooth U-shaped curve. It is symmetrical about , with its lowest point at , and passes through and . Label it .
(c)(i)
Points with equal -values, such as and , sit either side of the line of symmetry through the minimum point :
(c)(ii)
Draw a vertical line from to the curve and read across. As a check by substitution:
(d)
The line passes through , and . Draw it with a ruler; it meets the curve at two points. Reading the -coordinates:
Check: at the intersections , so , , giving or .
Maximum point, line of symmetry and intersection with a line
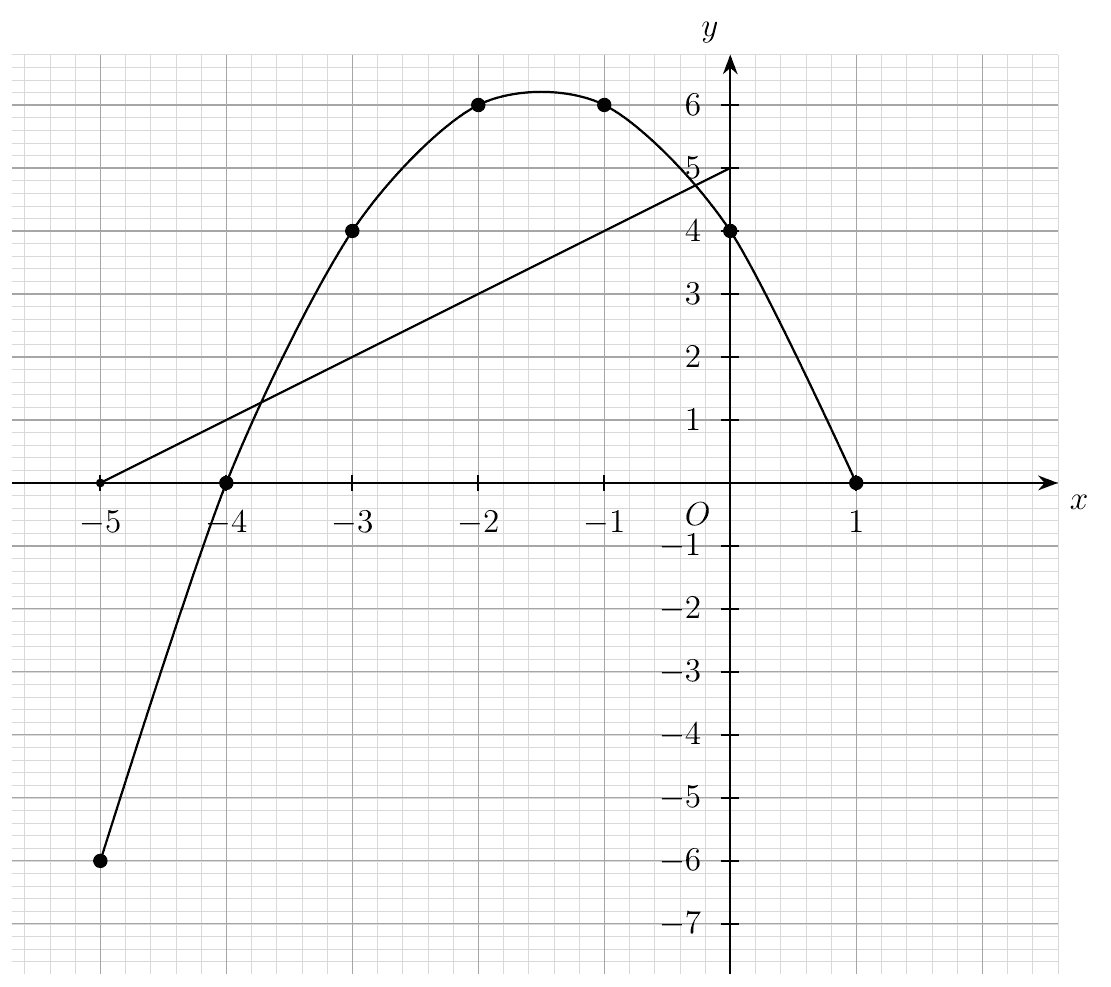
The variables and are connected by the equation . Some corresponding values of and are given in the table below.
Calculate the value of .
On the grid, draw the graph of for .
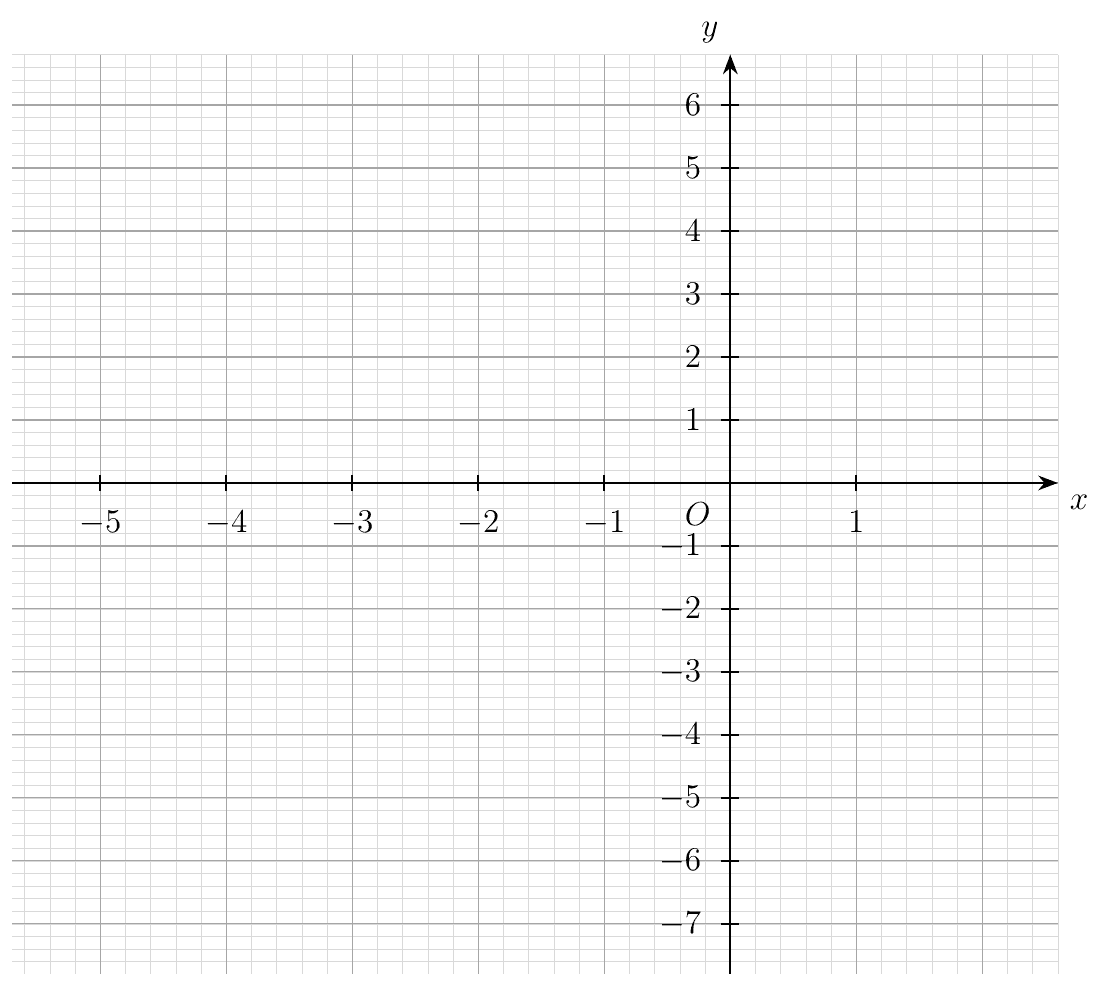
Using your graph, write down the maximum value of .
Write down the equation of the line of symmetry of the curve .
On the grid, draw the line for .
Write down the -coordinates of the points of intersection of the two graphs.
Show worked solution▾
(a)
(b)
Plot the seven points , , , , , , and join them with a smooth n-shaped curve. The curve rises a little above between and , so do not flatten the top.
(c)
The highest point of the curve is at . Reading across, the maximum value is about . (By substitution, .)
(d)
and have the same -value, so the line of symmetry is halfway between them:
(e)(i)
The line passes through , and ; it is drawn on the graph above.
(e)(ii)
Reading the -coordinates where the line crosses the curve:
Check: at the intersections , which rearranges to . Substituting gives , close to , as expected for a reading from a graph.
Quadratic curve and line: intersections and a triangle
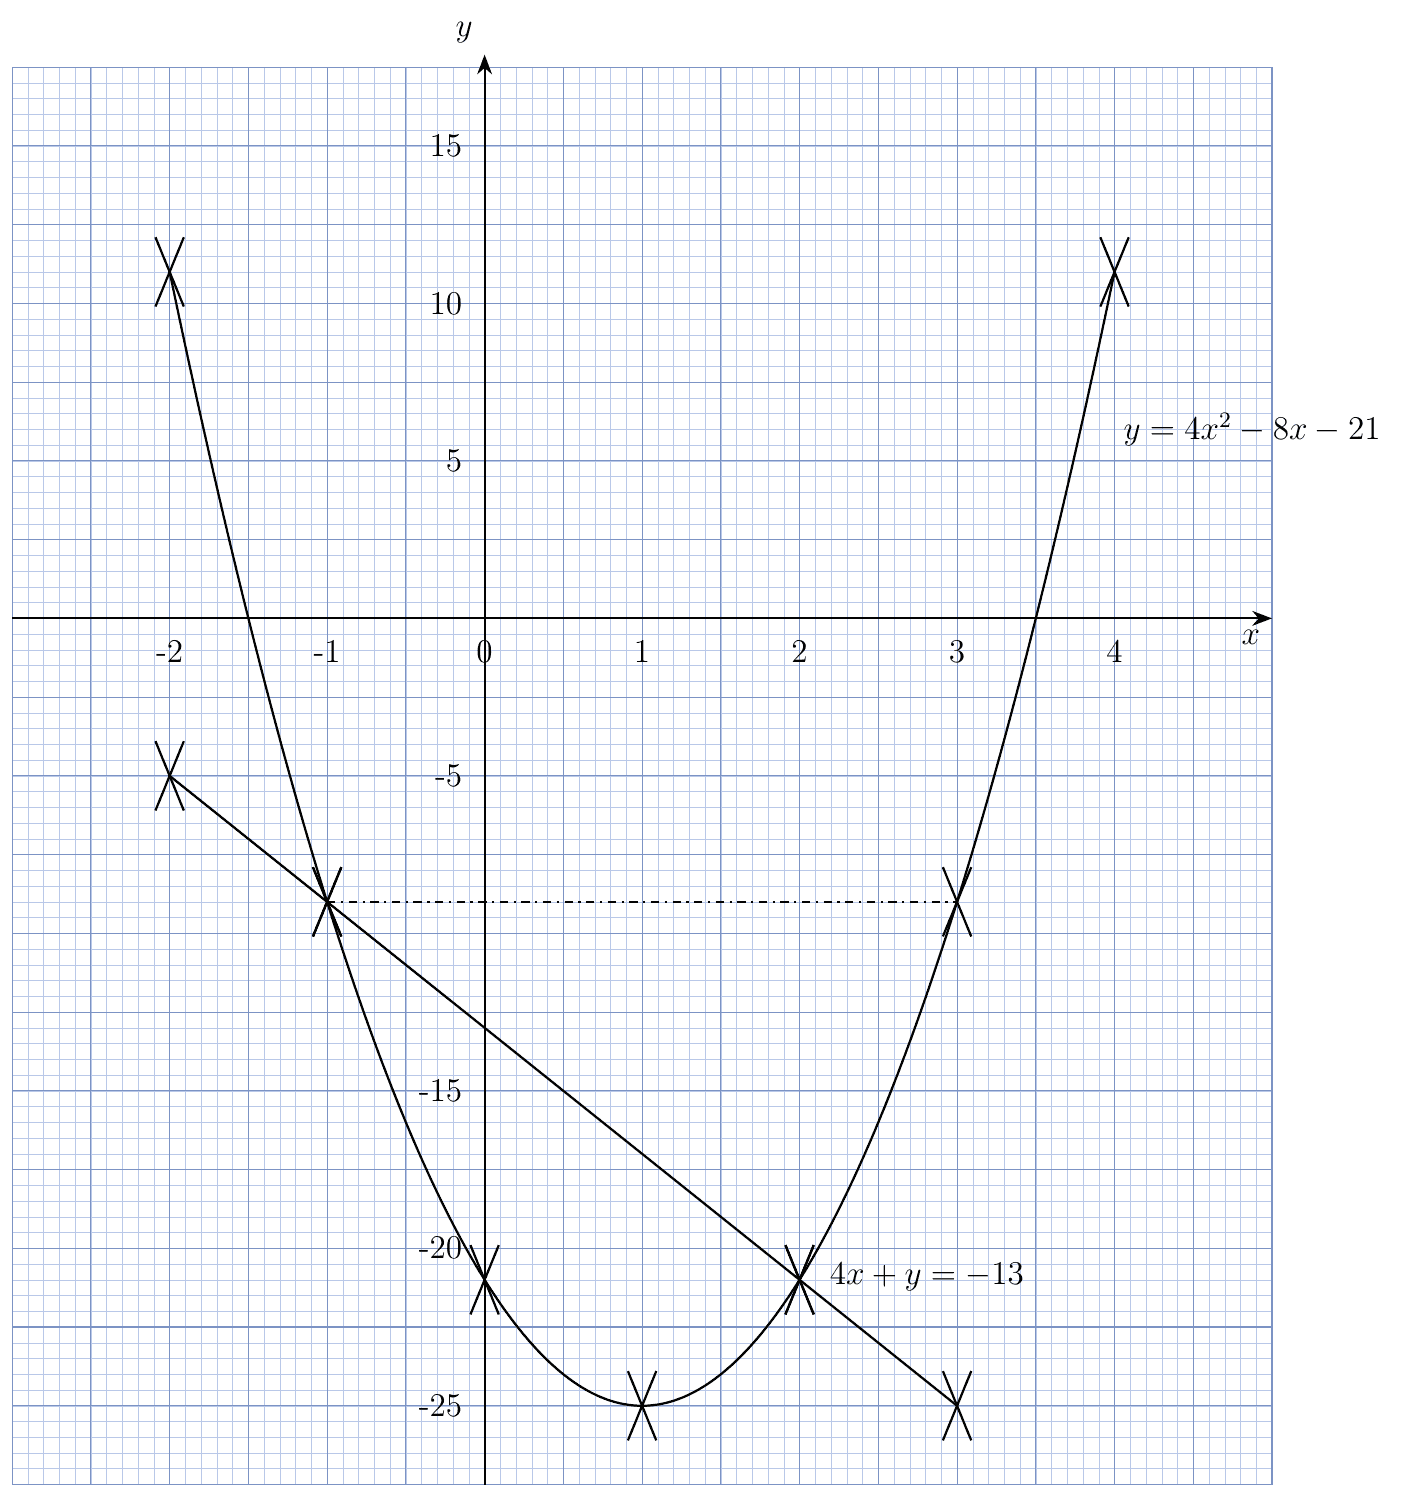
The variables and are connected by the equation .
Find the value of .
On the grid, draw the graph of for .
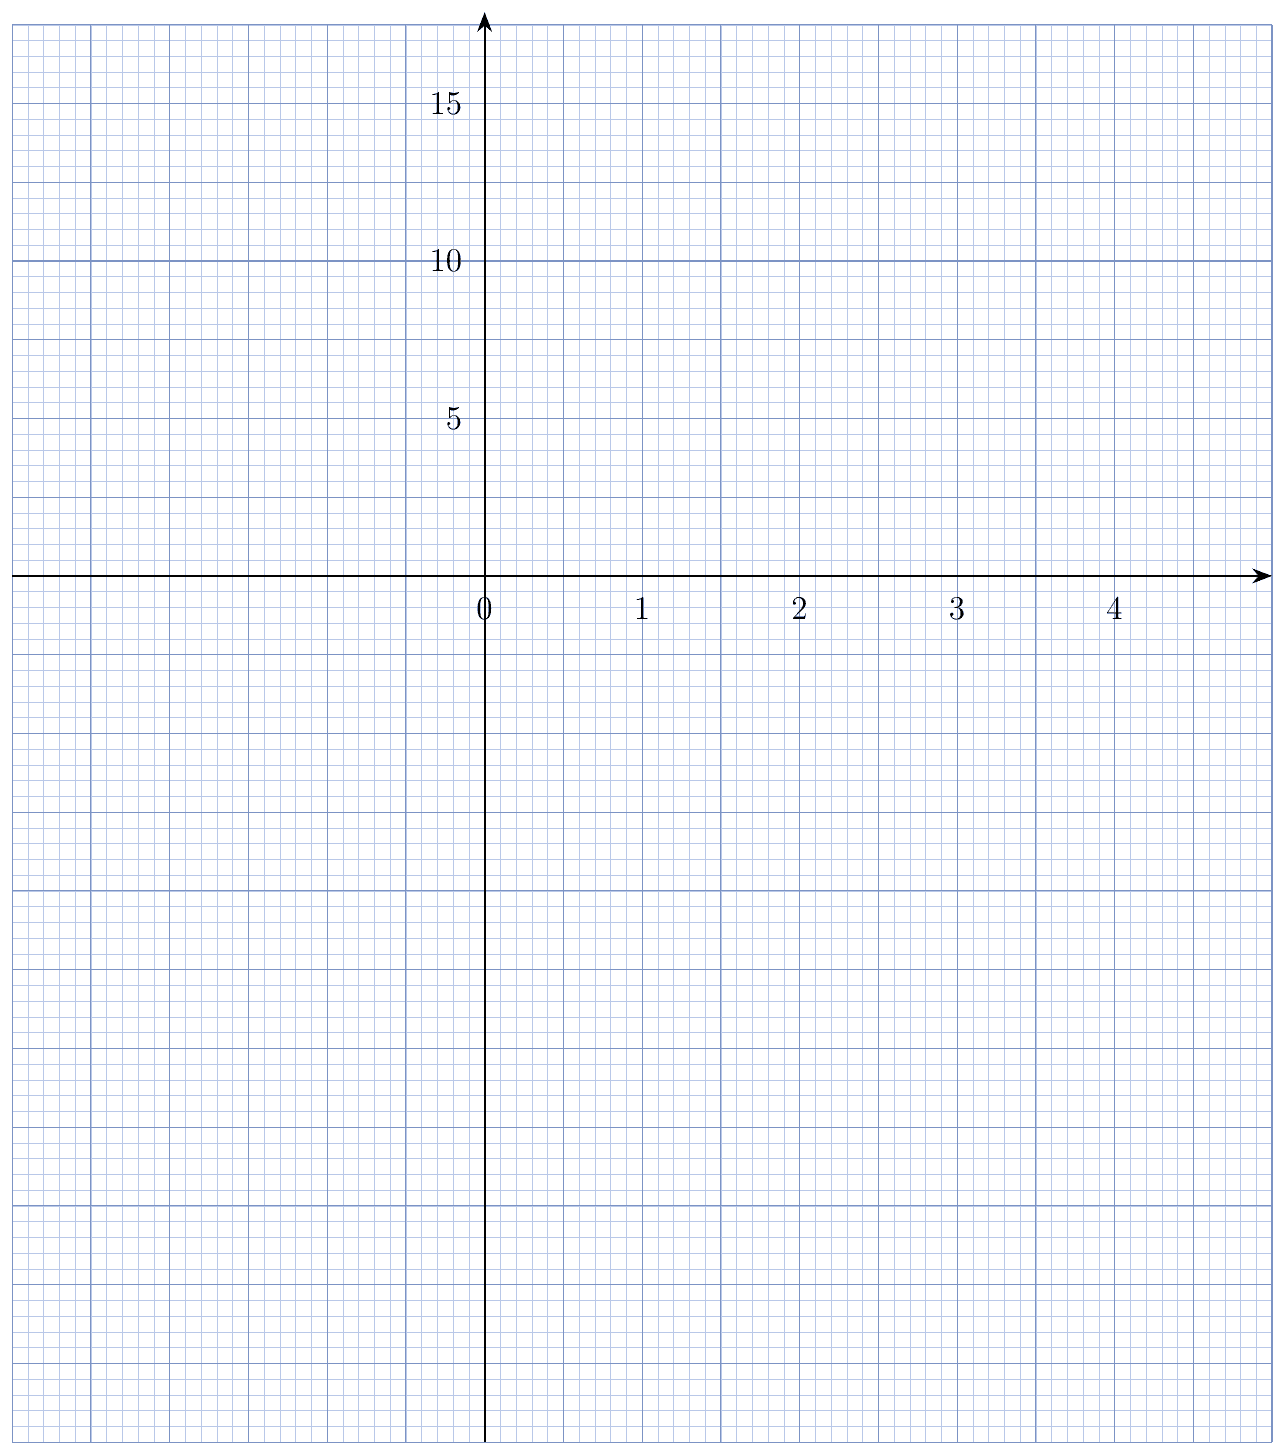
On the same grid, draw the line for .
Using your graph,
write down the coordinates of the points of intersection of the line and the curve.
A triangle is formed by the points of intersection points in (d)(i) and . Calculate the area of this triangle.
Show worked solution▾
(a)
Plot the seven points from the table and join them with a smooth U-shaped curve with its minimum at . Label the curve.
(c)
Rewrite the line as and work out a few points:
Plot these and join them with a ruler, as shown above.
(d)(i)
The line meets the curve at
Check: gives , so and .
(d)(ii)
The points and lie on the horizontal line , so take that side as the base. The height is the vertical distance from to :
Height of a ball from a quadratic graph
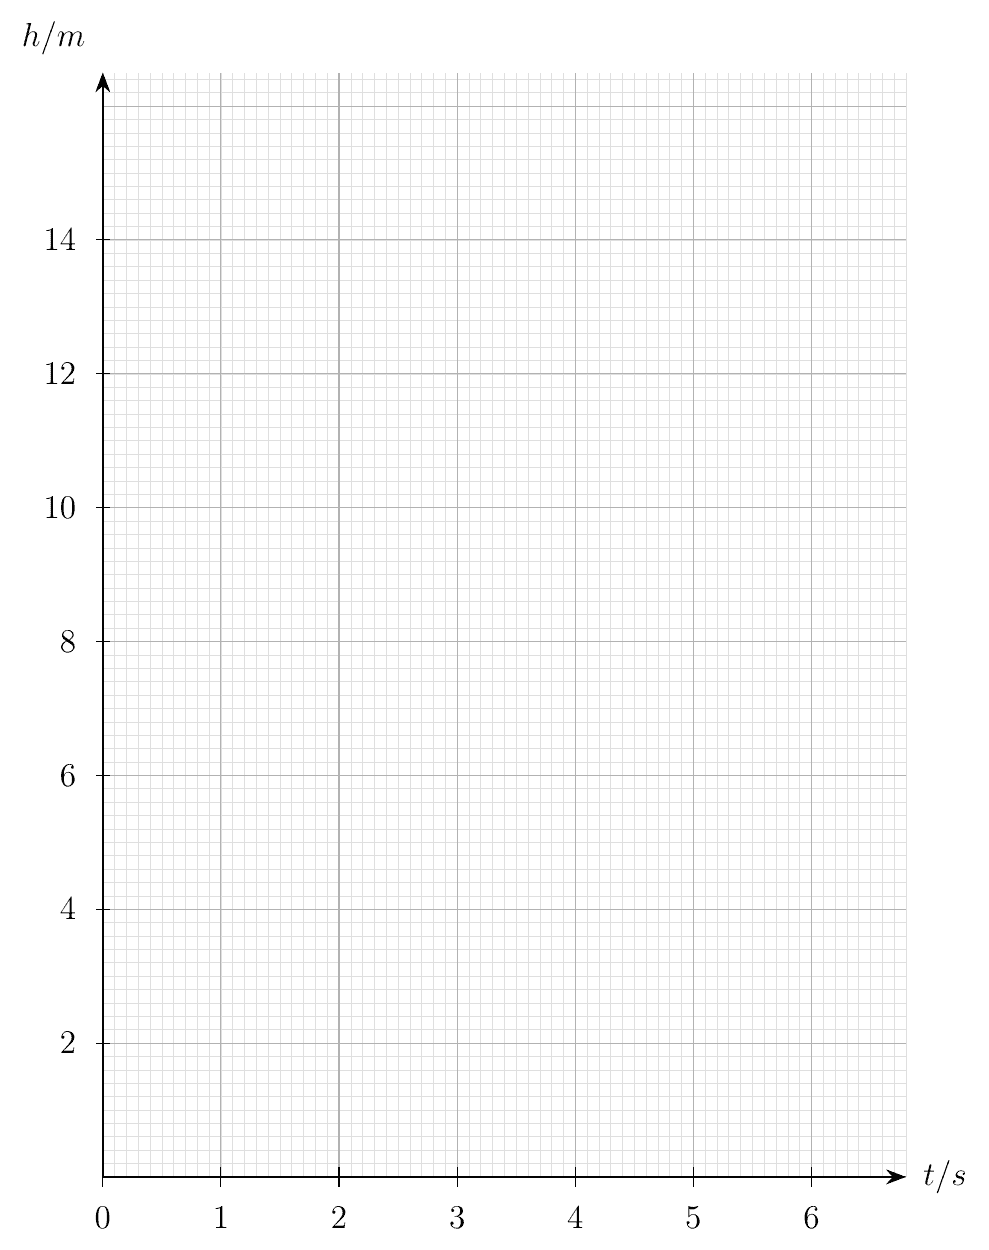
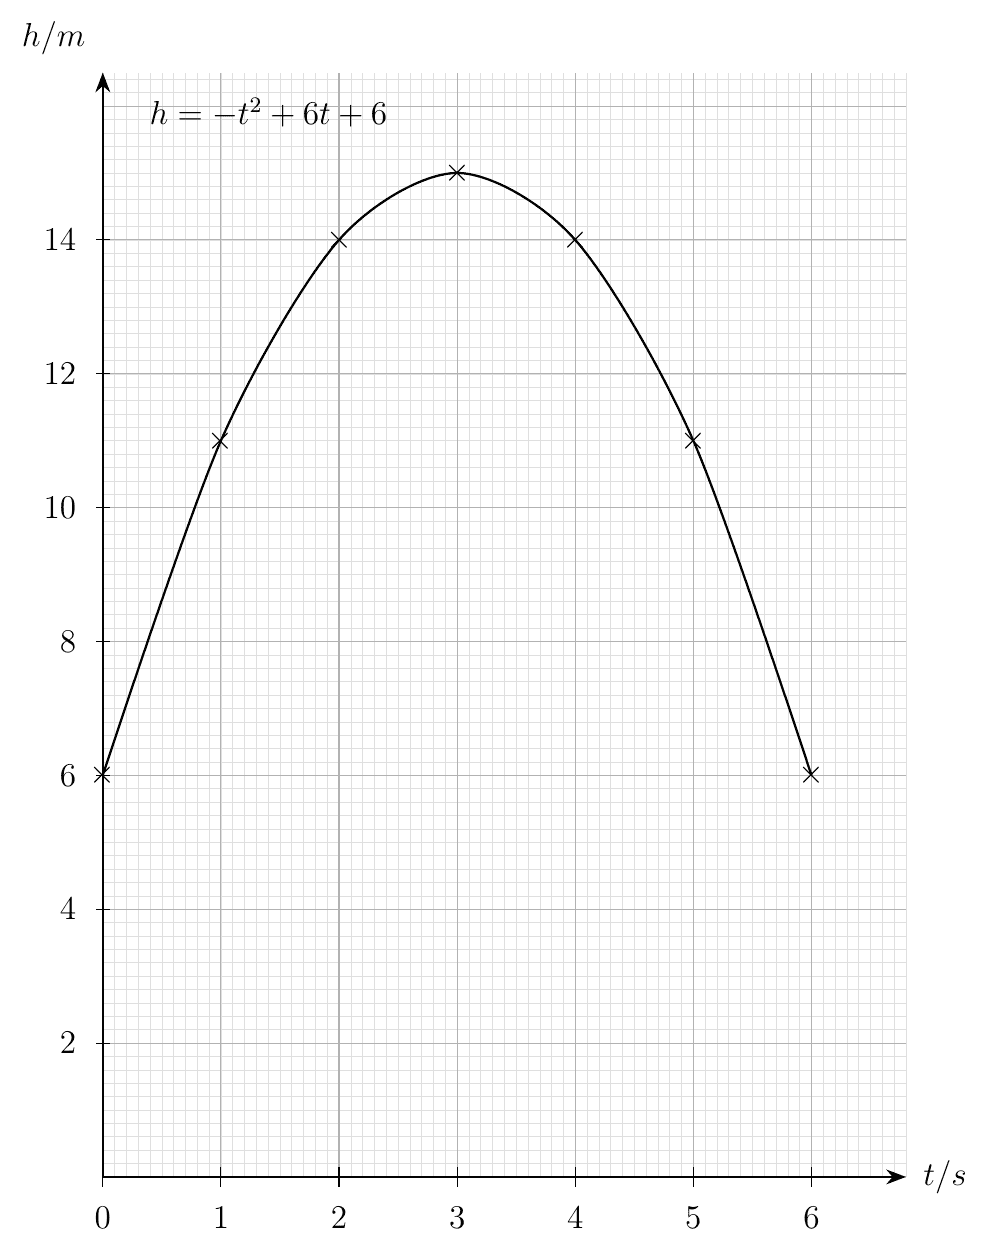
A ball bearing is thrown upwards where is the height of the ball above the ground in metres and is the time of the flight in seconds. The motion is given by . Some corresponding values of and are given in the following table.
Find the value of .
On the grid opposite, draw the graph of for .
Use the graph to find
the maximum height of the ball bearing,
the possible times, in seconds, when the ball bearing is at 10m.
Is the ball thrown from the ground level? Explain your answer.
Show worked solution▾
(a)
(b)
Plot , , , , , , and join them with a smooth curve.
(c)(i)
The highest point of the curve is at , so the maximum height is m.
(c)(ii)
Draw the horizontal line . It meets the curve twice, on the way up and on the way down:
(d)
No. At the height is m, so the ball starts m above the ground, not at ground level.
Flight path of a bird: landing point and maximum height
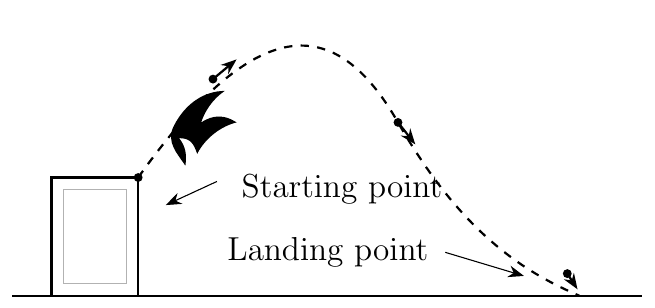
In a computer game, the flight path of a bird is modelled by the equation , where is the height of the bird above the ground at a horizontal distance, units, from the starting point. The landing point of the bird is at .
Some corresponding values of x and y are given in the table below.
Find the value of and .
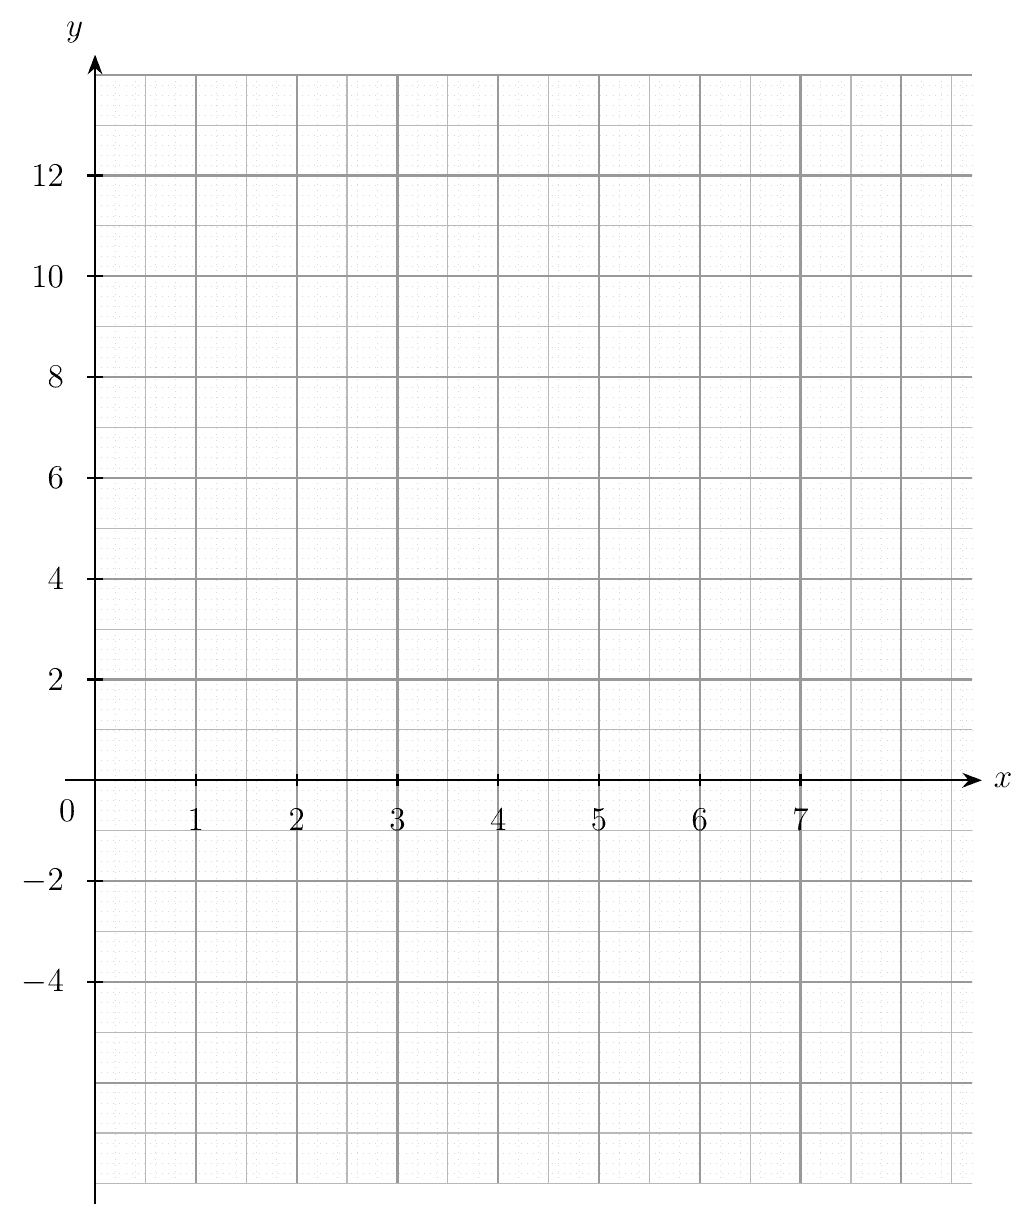
On the grid opposite, draw the graph of for .
Use your graph to find
the coordinates of the landing point,
the maximum height of the bird above the ground.
Show worked solution▾
(a)
(b)
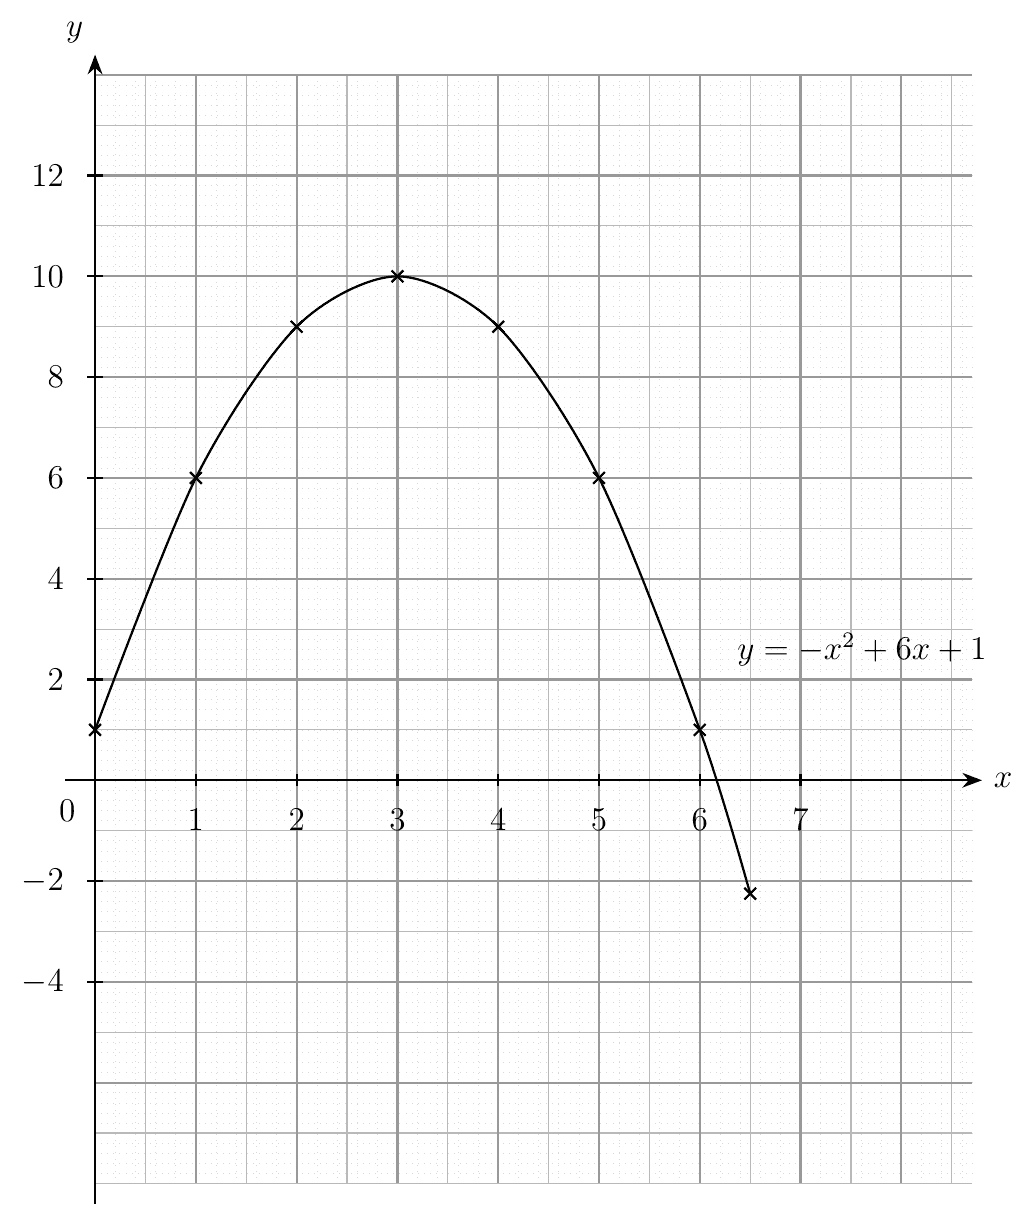
Plot the eight points and join them with a smooth n-shaped curve, symmetrical about .
(c)(i)
The bird lands where the curve crosses the -axis (), between (where ) and (where ). Reading from the graph, the landing point is about
(c)(ii)
The highest point of the curve is , so the maximum height is units.
Ball thrown from a building: reading times and heights
A ball it thrown upwards from the top of a building. The height metres, of the ball above the building after seconds is given by the equation . Some corresponding values of and t are given in the table below.
Find the values of and of .
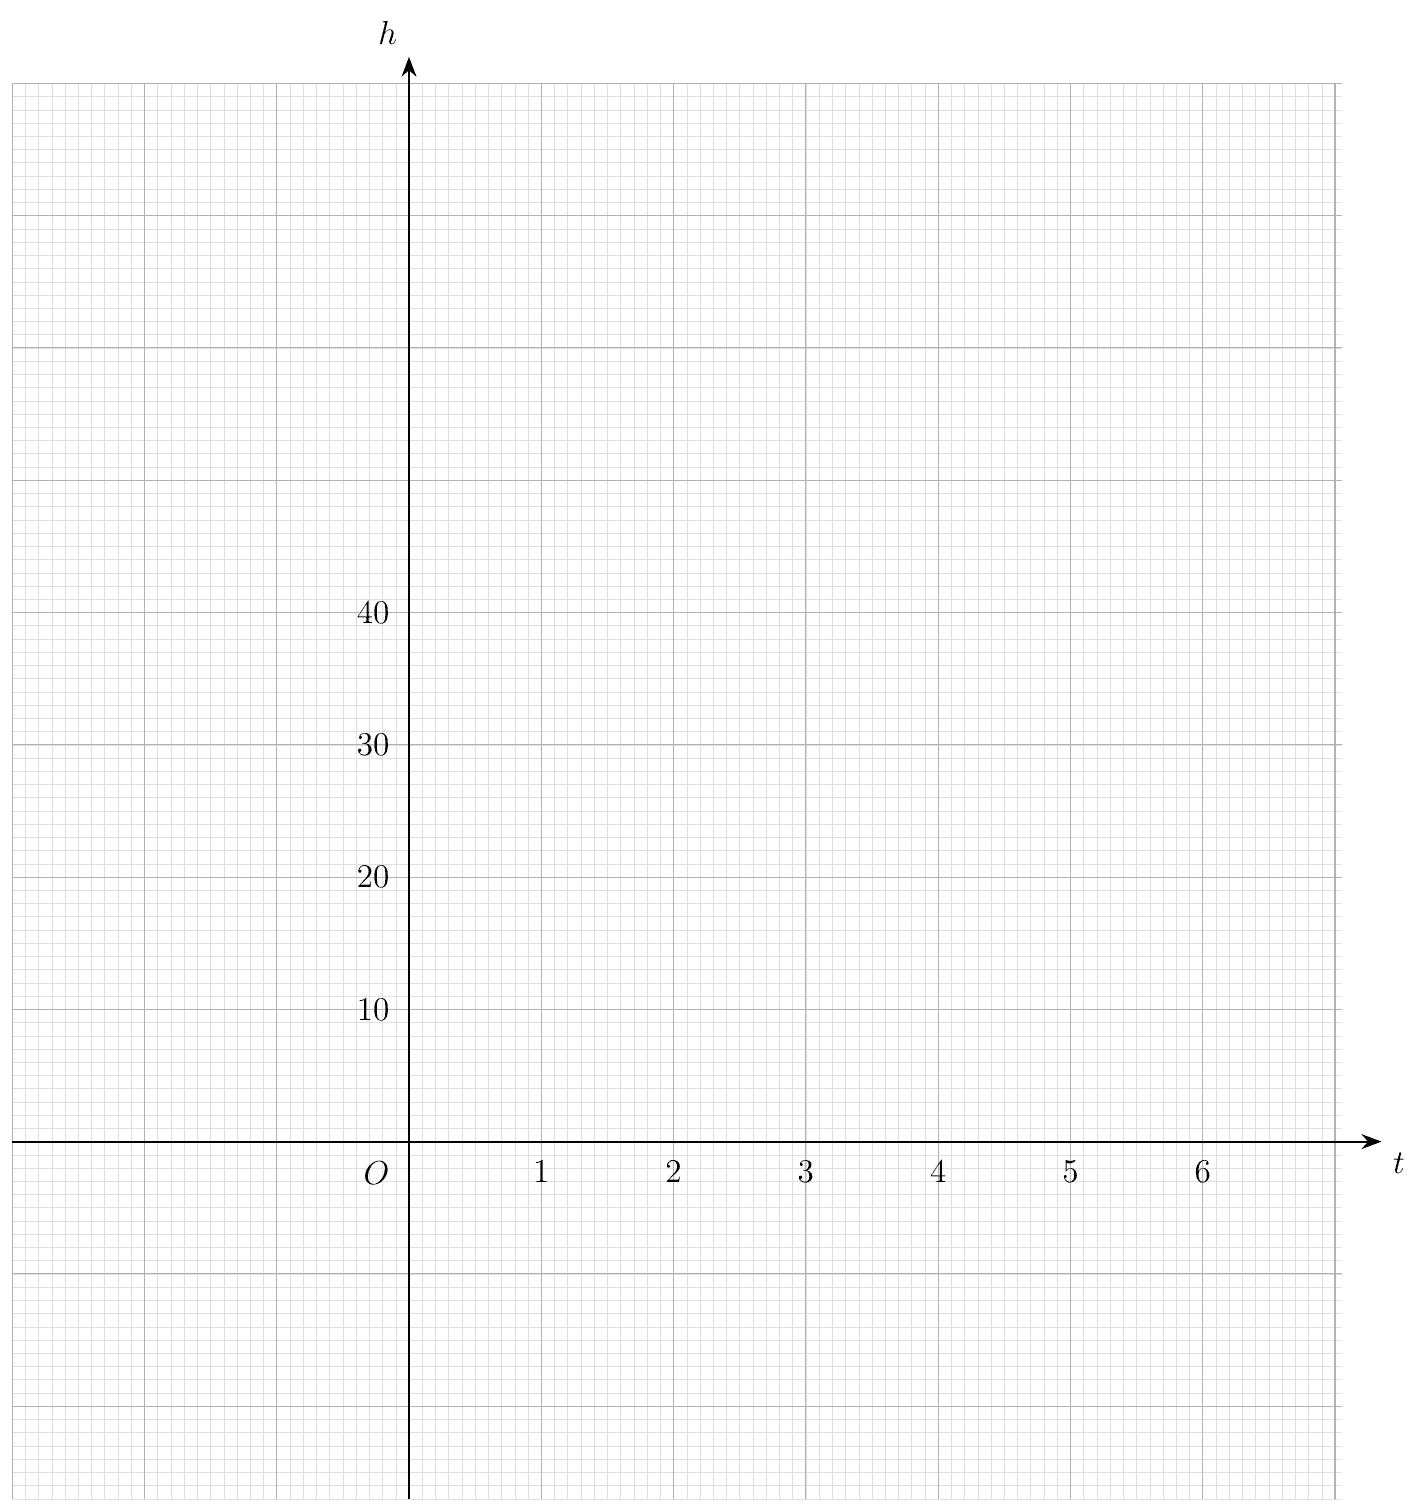
Draw the graph of for on the grid provided on the next page.
Using your graph, find the length of the time when the object is 26 m above the height of the building.
Find the time when the object will reach the greatest height.
Given that the ball hits the ground 6 seconds after it was thrown, state the height of the building from the graph.
Show worked solution▾
(a)
(b)
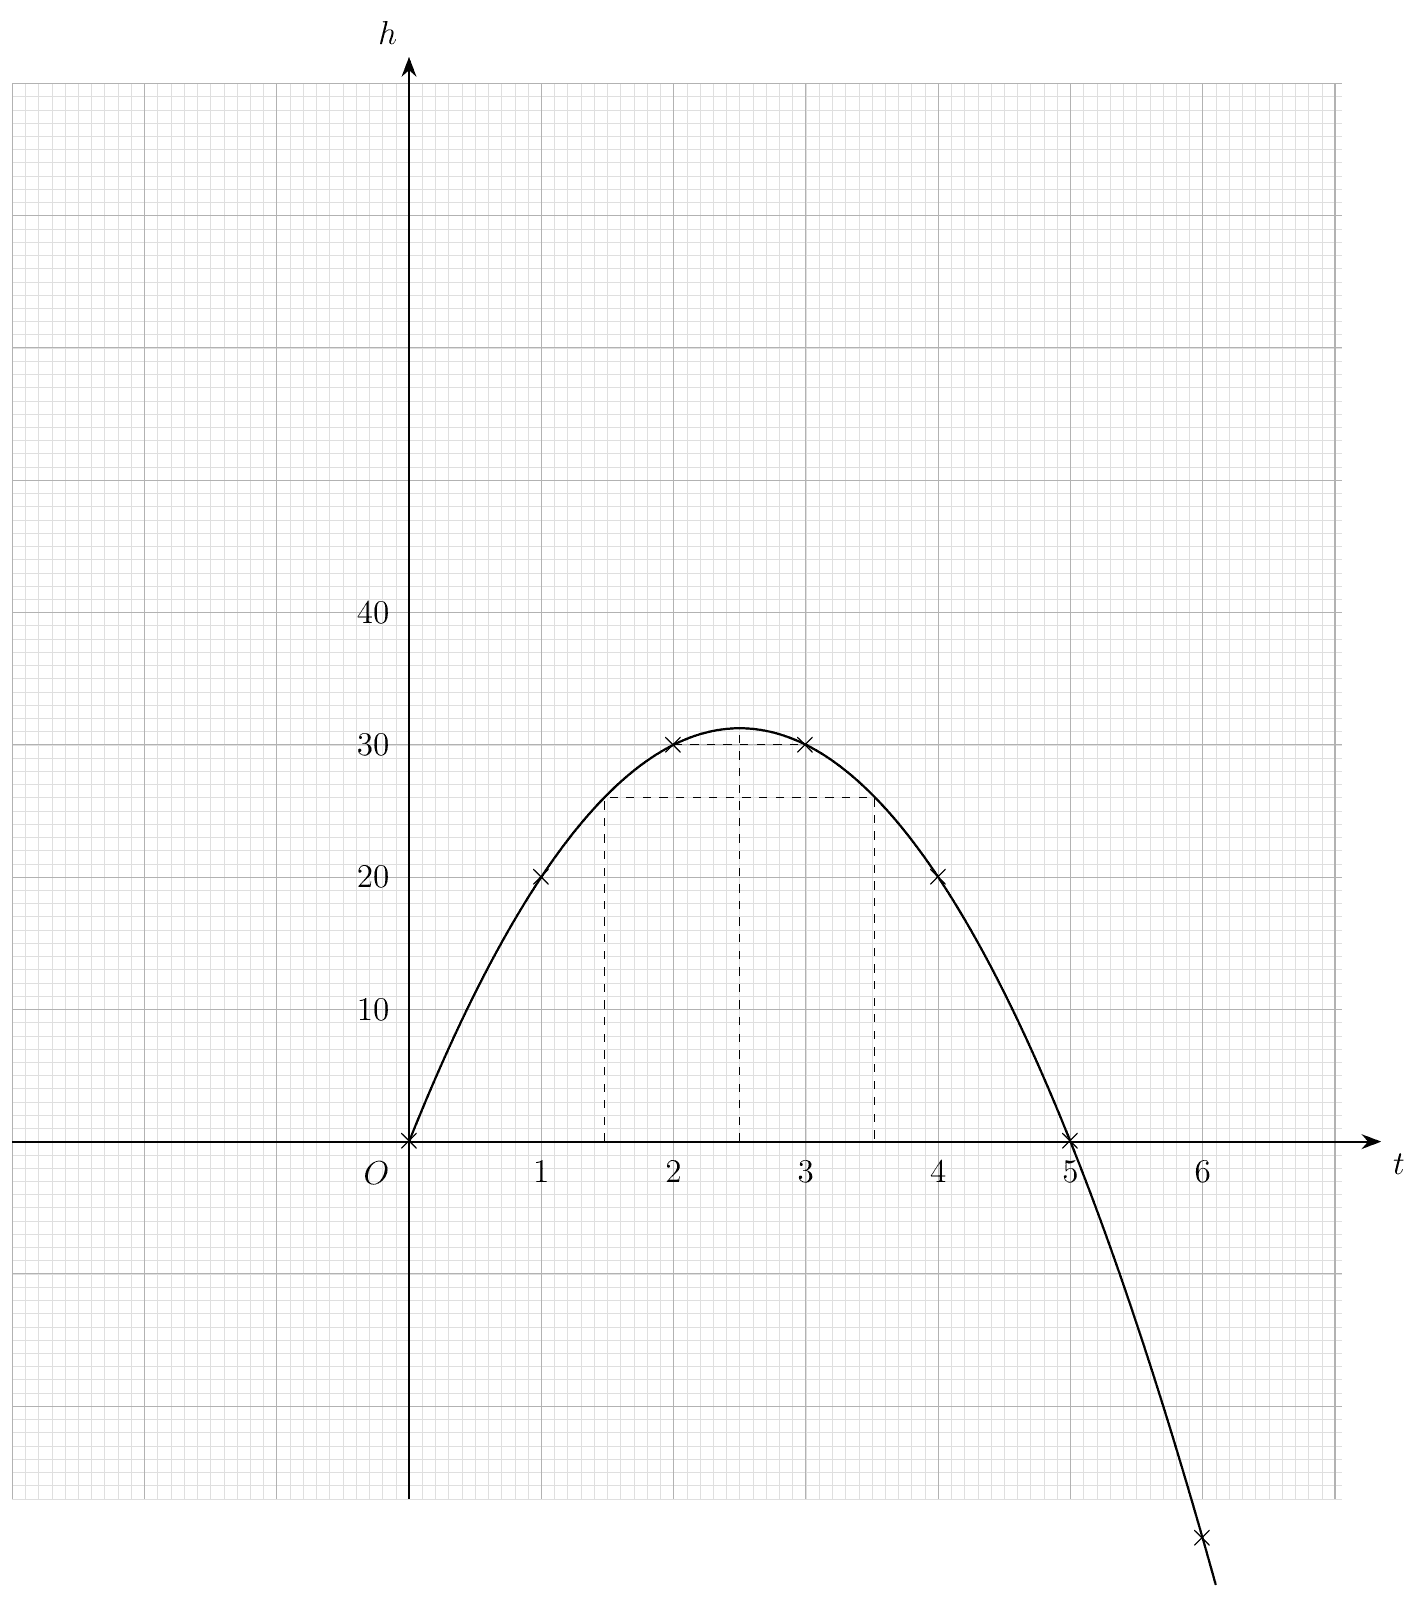
Plot the seven points and join them with a smooth n-shaped curve. It passes back through at (level with the top of the building) and continues below the -axis to .
(c)
Draw the horizontal line . It meets the curve at about and . The ball is at least m above the building between these times:
(d)
The curve is symmetrical: at and , and at and . The greatest height is halfway:
(e)
At the graph gives , so the ball is m below the top of the building when it hits the ground. The building is m tall.
Path of an arrow: greatest height and distances
An arrow was fired from a raised platform towards a field. The vertical height of the arrow, metres above the ground, at a horizontal distance metres from the platform, is given by , .
The table below shows some corresponding values of and .
Find the value of .
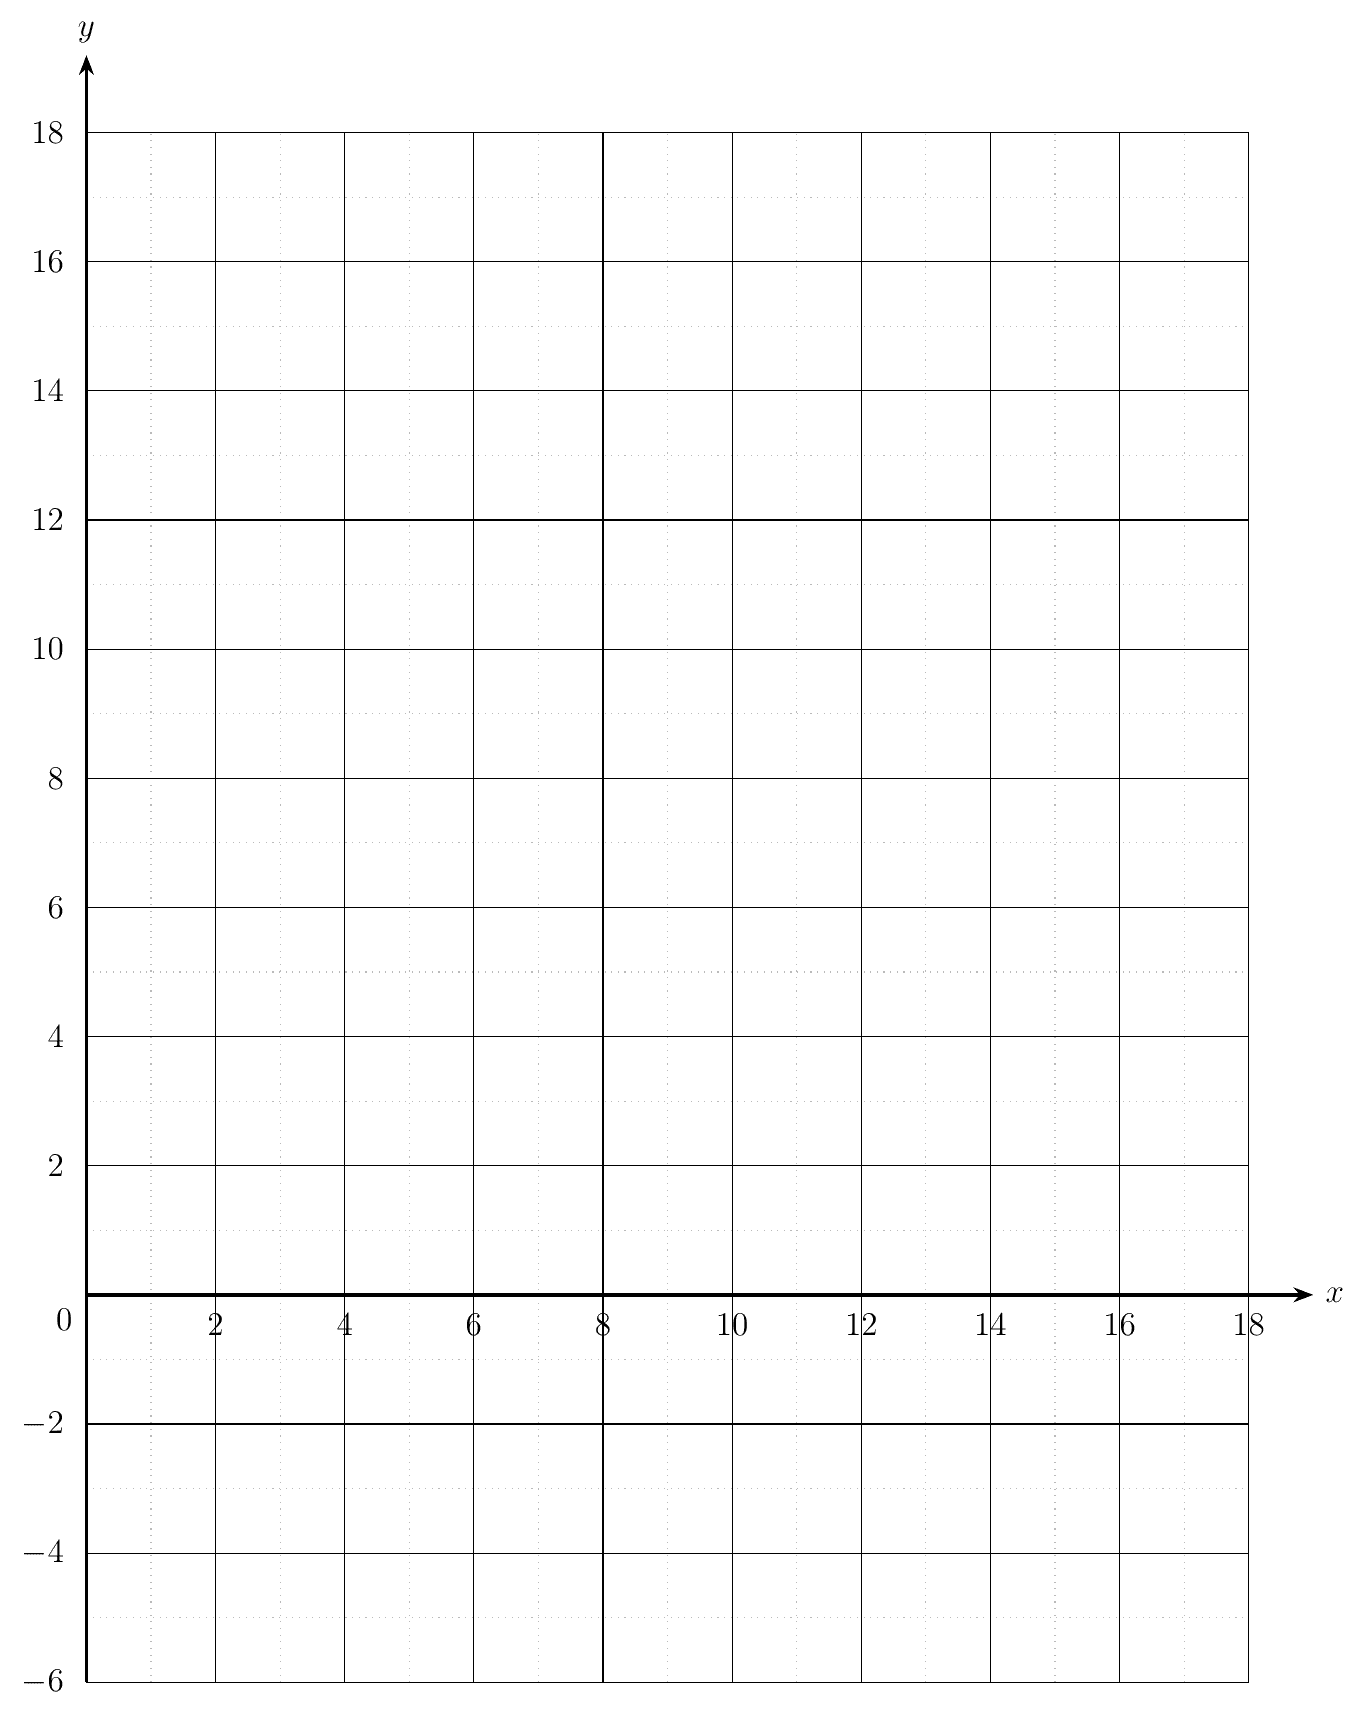
On the grid opposite, draw the graph of for .
Use your graph to find
the greatest height reached by the arrow,
the horizontal distance, travelled by the arrow before it hits the ground,
the horizontal distance for which the arrow was more than 14 metres above the ground.
Show worked solution▾
(a)
(b)
Plot the nine points , , , , , , , and , and join them with a smooth n-shaped curve. The curve is symmetrical about (halfway between and , which have equal heights), with its highest point a little above , and it crosses the -axis between and .
(c)(i)
The highest point is at . Reading across, the greatest height is about
(By substitution, .)
(c)(ii)
The arrow hits the ground where the curve crosses the -axis:
(c)(iii)
Draw the horizontal line . It meets the curve at about and :
Area of a rectangular garden as a quadratic graph
Sarah wants to build a rectangular garden. The total perimeter of the garden is 36 meters. The breadth of the garden is m, and the area of the garden is m.
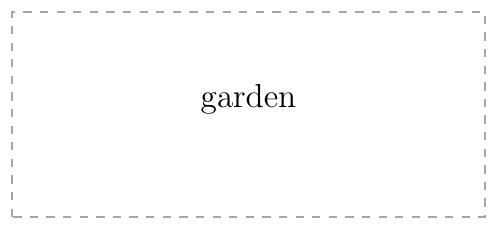
Show that .
The variables and are connected by the equation . Some corresponding values of and are given in the table below.
Find the value of .
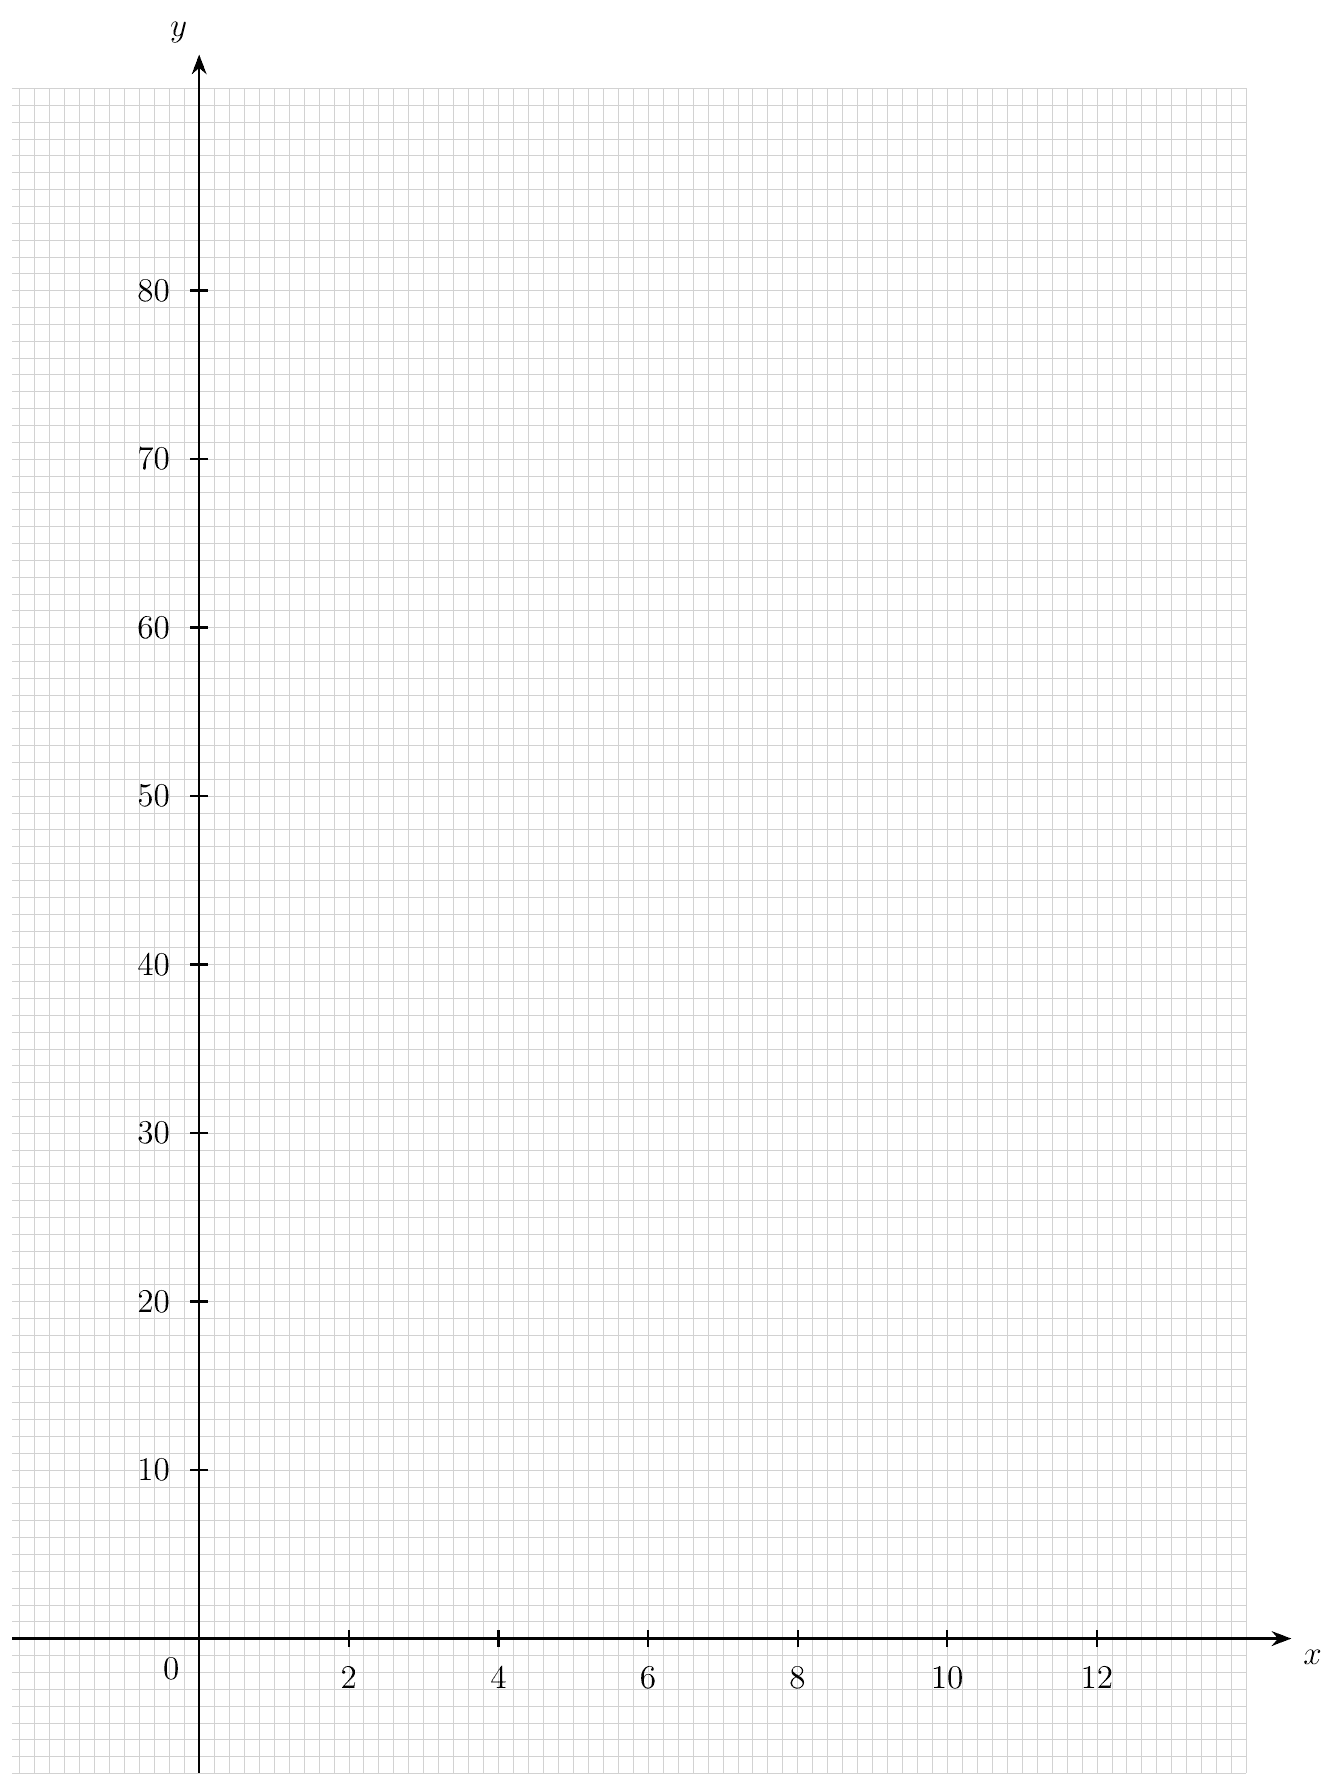
On the grid next page, draw the graph of for .
Use your graph to estimate the breadth(s) of the garden when the area is 75 m.
Show worked solution▾
(a)
Length and breadth together make half the perimeter, m, so the length is m:
(b)(i)
(b)(ii)
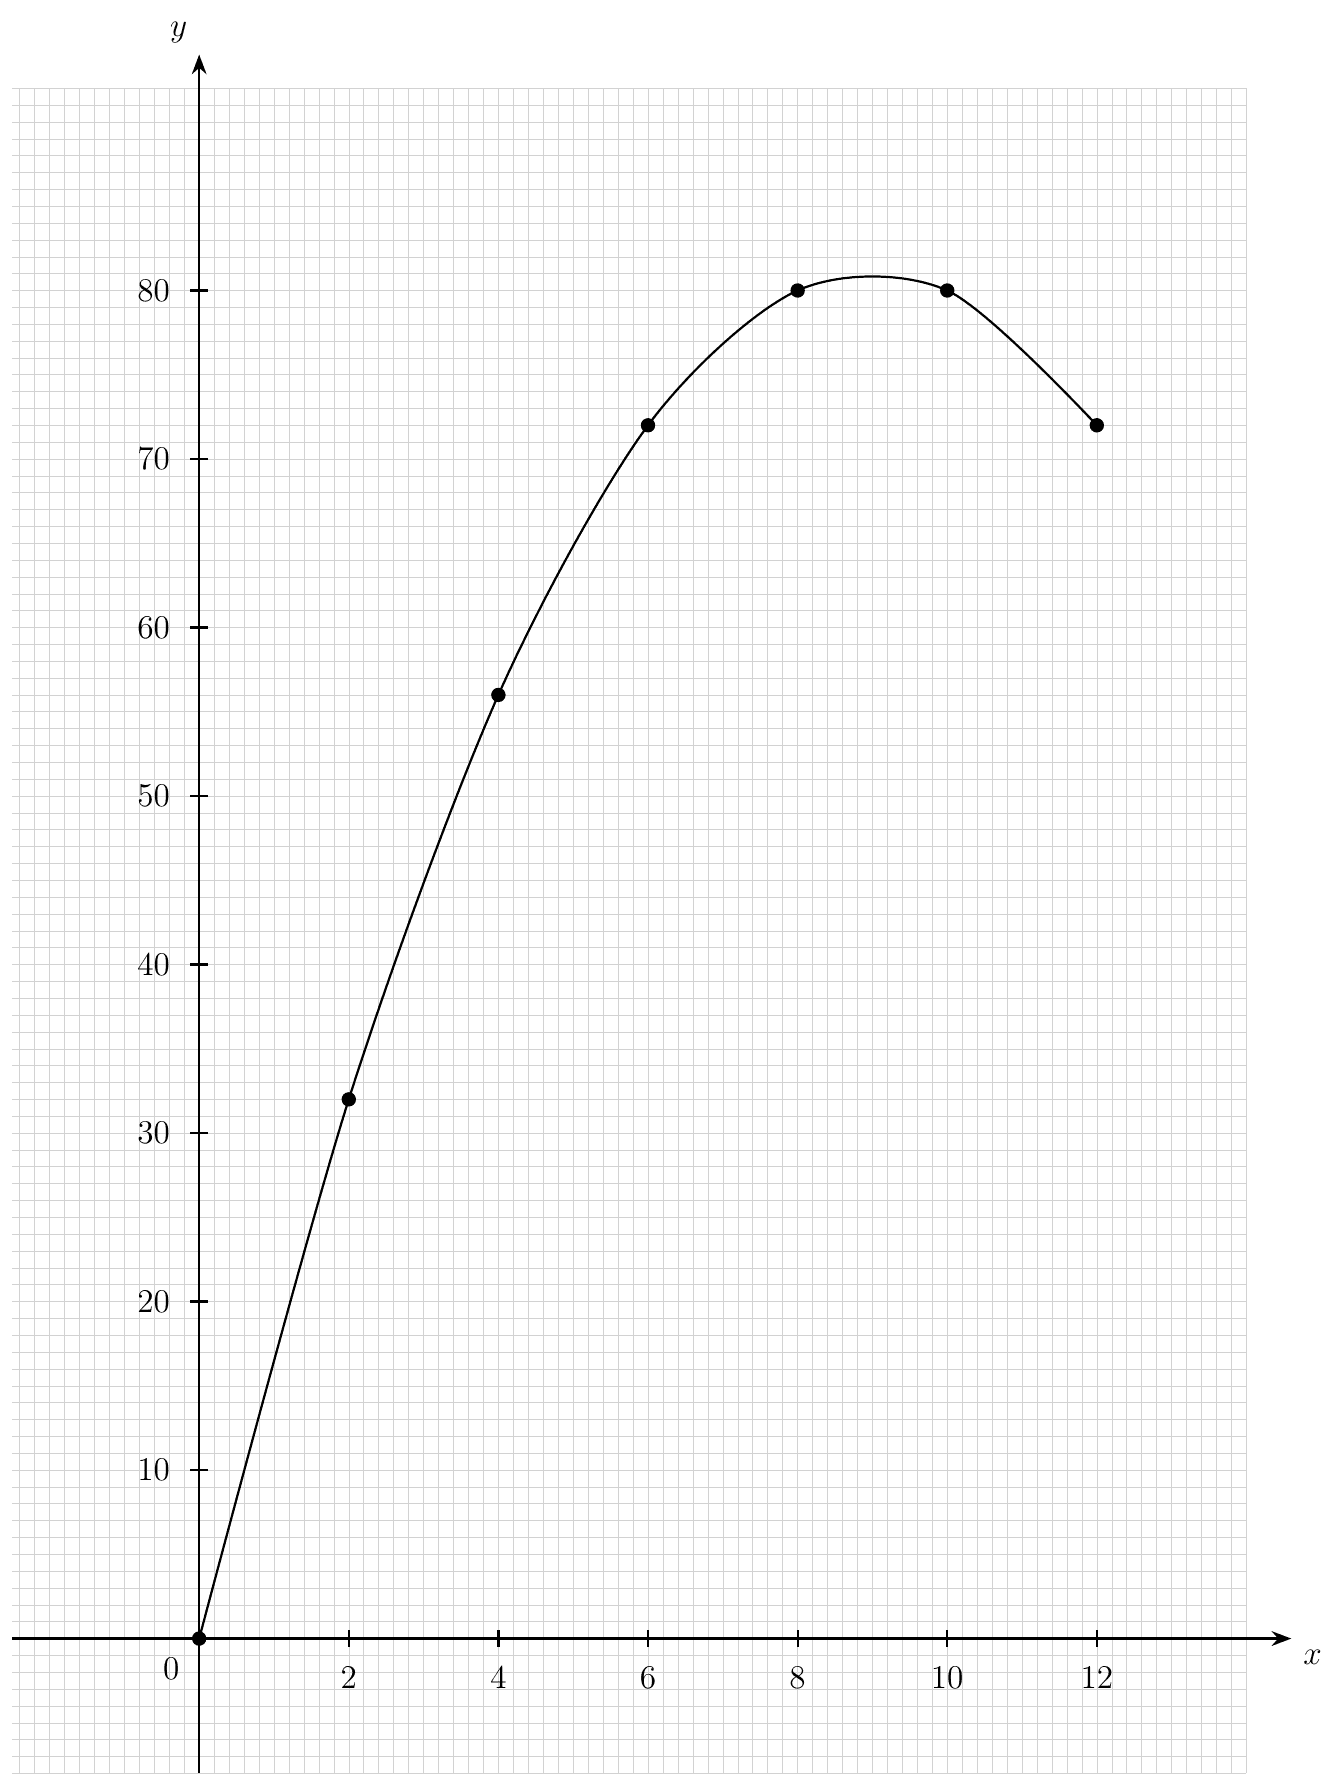
Plot the seven points and join them with a smooth curve rising from to a maximum at and coming down to .
(b)(iii)
Draw the horizontal line . It meets the curve twice:
Note: the school answer is m or m. Substituting shows the curve is below at () and above it at (), so the first crossing is about m, and the second, by symmetry about , is about m.