
Free practice / Secondary 3 A Maths
Sec 3 A Math: Linear Law, practice questions & worked solutions
Linear Law practice questions selected from 2025 Singapore school A Math prelim papers, each with a full worked solution.
About this topic & key methods
These questions practise Sec 3 topics; the source papers are Sec 4 prelims. Questions requiring later Sec 4 methods are excluded.
Attempt each question on paper before opening its worked solution. Keep the source question number when checking against the original paper.
Key methods
- Choose variables that turn a non-linear relationship into a straight line.
- Interpret the gradient and intercept in terms of the original constants.
- Plot transformed data and draw a suitable straight line.
- Use the model to estimate values or identify an anomalous reading.
For guided practice, see our Sec 3 A Maths tuition programme.
Questions & worked solutions
Unless the question specifies otherwise, give numerical answers to 3 significant figures and angles in degrees to 1 decimal place. Angles in radians are stated explicitly.
Linear Law
In a biology experiment, a certain type of bacteria multiplies rapidly. The number of bacteria, , after hours is modelled by the formula , where and are constants. The table below shows corresponding values of and .
| 2 | 4 | 6 | 8 | |
|---|---|---|---|---|
| 900 | 2700 | 8100 | 24 300 |
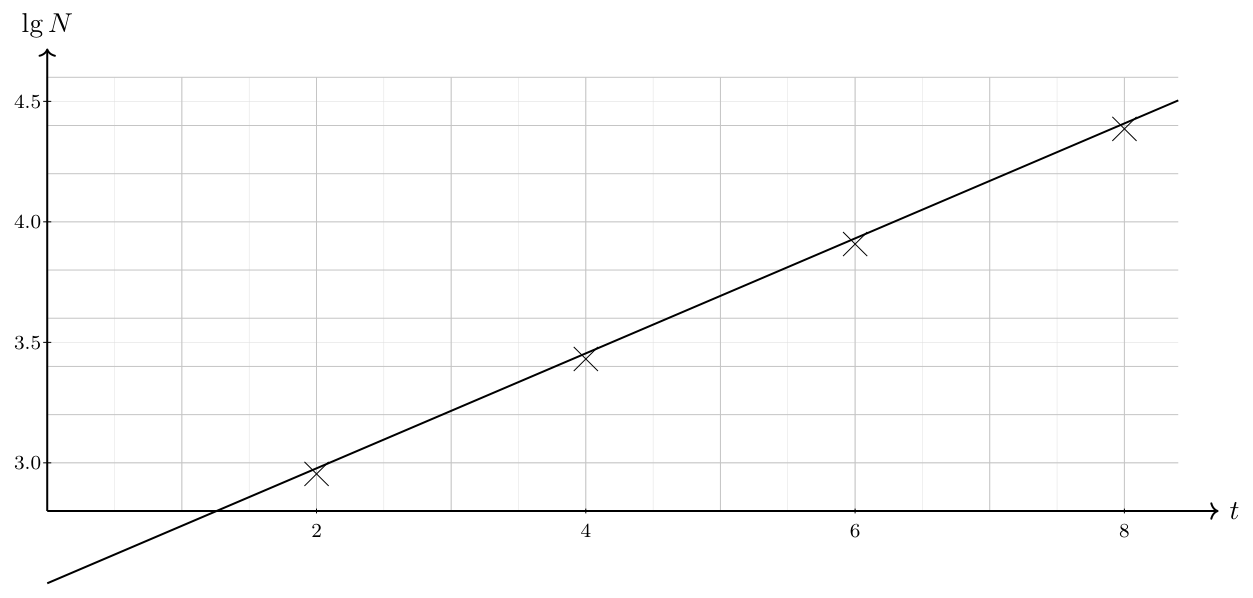
On the grid on the next page, plot against and draw a straight line graph to illustrate the information.
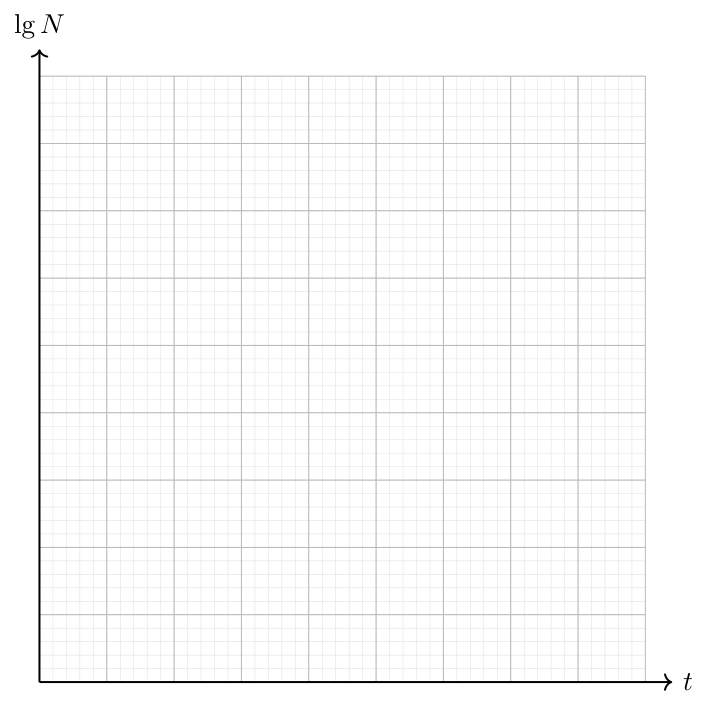
Use the graph to estimate the value of each of the constants and .
Show worked solution▾
(a)
(b)
Linear Law
The mass, mg, of a radioactive substance decreases with time, hours. It is known that and are related by the equation , where and are constants. The table below shows measured values of and .
| (hours) | 1 | 2 | 3 | 4 | 5 |
|---|---|---|---|---|---|
| (mg) | 6.55 | 5.36 | 4.40 | 3.60 | 2.94 |
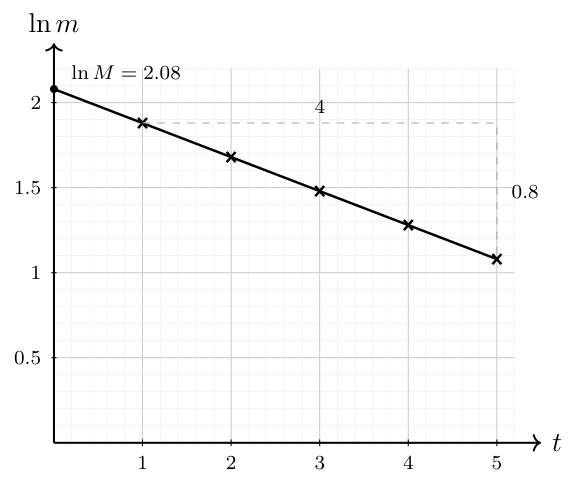
Plot against and draw a straight line graph.

Use your graph to estimate the initial mass of the substance,
the value of .
Show worked solution▾
(a)
| 1 | 2 | 3 | 4 | 5 | |
|---|---|---|---|---|---|
| 6.55 | 5.36 | 4.40 | 3.60 | 2.94 | |
| 1.88 | 1.68 | 1.48 | 1.28 | 1.08 |
Plot against and draw a straight line graph.
(b)
(c)
Linear Law
For the equation where is an unknown constant, it may be represented by a straight line, expressed in the form , where and are functions of and/or and and are constants. Using the following table, insert in it an expression for , , and .
The variables and are related by the equation , where and are constants. The table below shows some corresponding values of and .
1.31 1.63 1.97 2.54 4.03 1270 398 131 35.1 2.63 Plot against and draw a straight line graph.
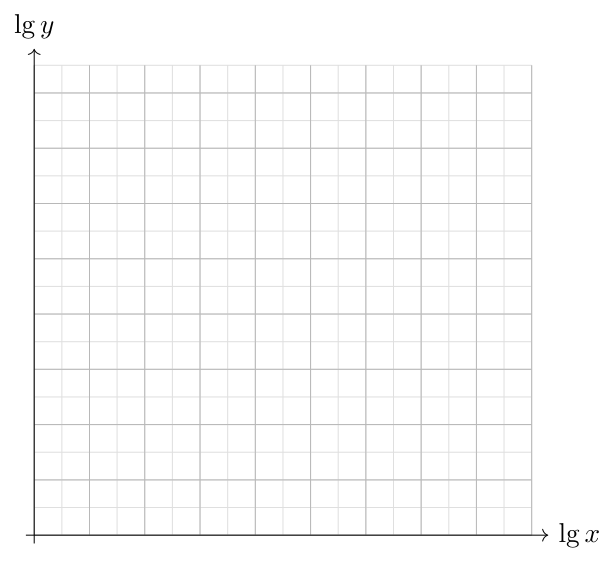
Use your graph to estimate the value of and of .
Show worked solution▾
(a)
| (OR) | ||||
| (OR) |
(b)
(i)
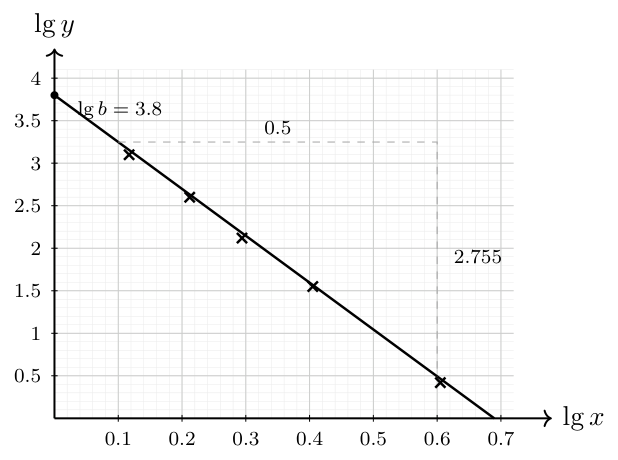
| 0.117 | 0.212 | 0.294 | 0.405 | 0.605 | |
|---|---|---|---|---|---|
| 3.10 | 2.60 | 2.12 | 1.55 | 0.420 |
Plot against and draw a straight line graph.
(ii)
Linear Law
The table shows experimental values of two variables and .
| 1 | 2 | 3 | 4 | 5 | 6 | 7 | |
|---|---|---|---|---|---|---|---|
| 56.2 | 31.5 | 25.1 | 9.96 | 5.60 | 3.14 | 1.76 |
The variables and are related by the equation , where and are constants. It is believed that an error was made in one of the experimental values of .
On the grid, on the next page, plot against and draw a straight line graph to illustrate the information using a scale of 2 cm to represent 1 unit on the horizontal axis and 8 cm to represent 1 unit on the vertical axis.
Use your graph to
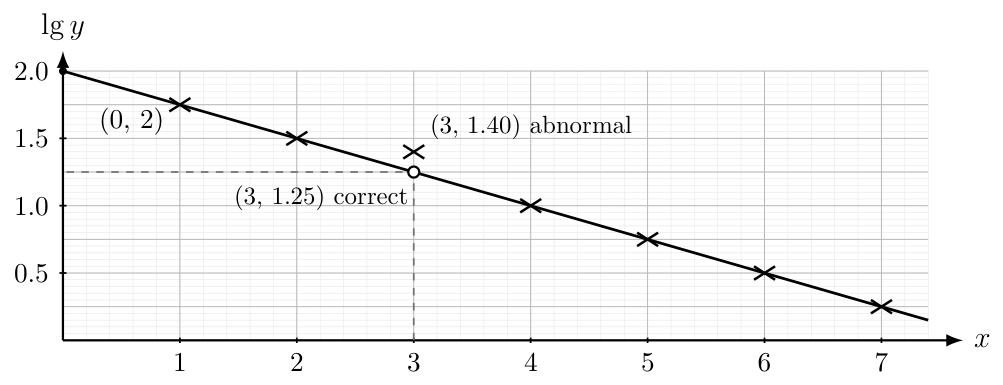
identify the abnormal reading of and estimate the correct value of ,
find the value of and .
Show worked solution▾
(a)
| 1 | 2 | 3 | 4 | 5 | 6 | 7 | |
|---|---|---|---|---|---|---|---|
| 56.2 | 31.5 | 25.1 | 9.96 | 5.60 | 3.14 | 1.76 | |
| 1.75 | 1.50 | 1.40 | 1.00 | 0.75 | 0.50 | 0.25 |
(b)
(i) is an abnormal reading of .
correct value of :
(ii)
Linear Law
A scientist is studying how the concentration of a chemical solution (, in mg/L) decreases over time (, in hours) during a natural breakdown process.
The table below shows some recorded values of and .
| 0.8 | 1.0 | 1.2 | 1.4 | 1.8 | |
|---|---|---|---|---|---|
| 21.0 | 15.0 | 10.8 | 7.5 | 2.1 |
It is believed that and are related by the equation , where and are constants.
Express the given equation in a form suitable for drawing a straight line graph, and using suitable scales, draw the graph for the values given on a graph paper.

Use your graph to estimate the value of each of the constants and .
The chemical is considered harmful to plants when its concentration exceeds 30 mg/L. Use your graph to determine whether the chemical is safe for plants at time . Justify your answer.
Show worked solution▾
(a)
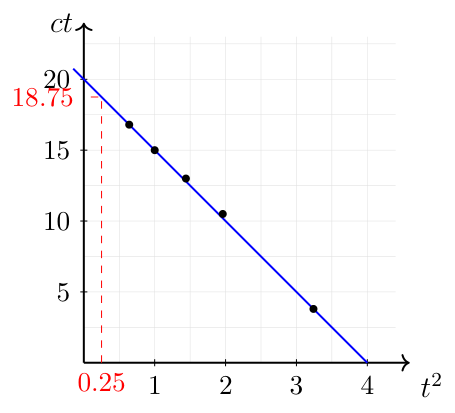
Draw against .
| 0.64 | 1 | 1.44 | 1.96 | 3.24 | |
|---|---|---|---|---|---|
| 16.8 | 15.0 | 13.0 | 10.5 | 3.8 |
(b)
(c)
When , .
When , Since the concentration is greater than mg/L, the chemical is not safe for plants when h.
Linear Law
The mass, grams, of the decomposition of a radio-active substance is given by the formula , where and are constants, and is the number of weeks after the initial measurement of the mass. Experimental values of and are given in the table below.
| 1 | 2 | 3 | 4 | 5 | |
|---|---|---|---|---|---|
| 1.51 | 0.454 | 0.137 | 0.0183 | 0.0124 |
What does the constant refer to?
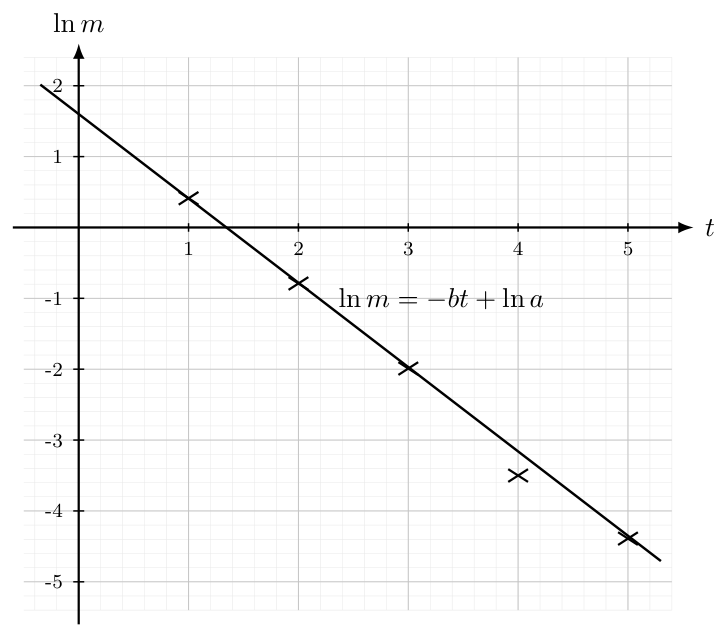
By drawing a suitable straight line graph using the data provided, estimate the value of and of .
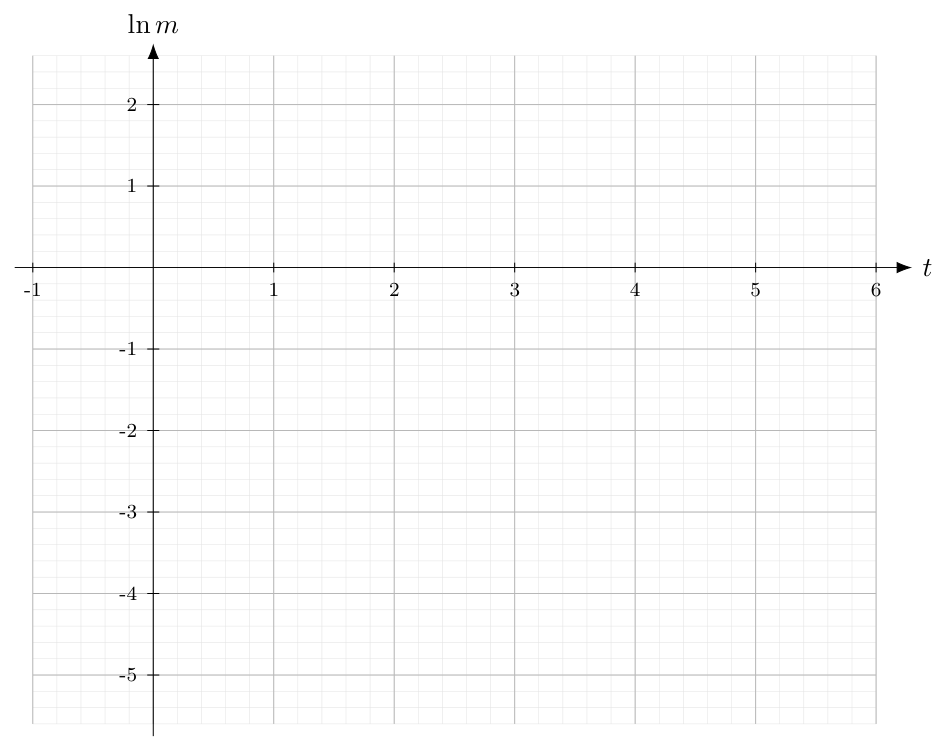
It is discovered that one of the readings of the mass, , is incorrect. Using your graph, estimate the correct value for this incorrect reading.
Show worked solution▾
(a)
The constant refers to the initial mass of the radio-active substance.
Or
The constant refers to the mass of the radio-active substance when .
(b)
| 1 | 2 | 3 | 4 | 5 | |
|---|---|---|---|---|---|
| 0.412 |
(c)
When ,
Linear Law
The variables and are known to be related by the formula , where and are constants.
The table below shows some experimental values of and .
1 2 3 4 5 8.55 6.20 5.32 5.72 6.00 On the grid below, plot against and draw a straight line graph.
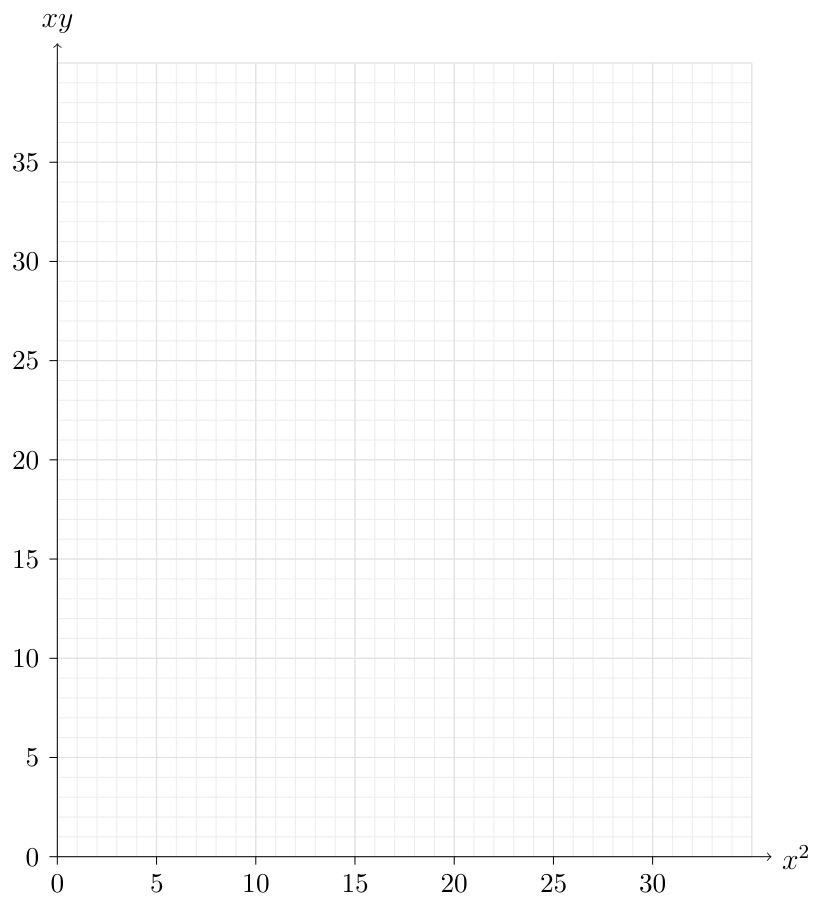
Use your graph to estimate
the value of and of ,
the positive value of that satisfies the equation .
Explain how another straight line graph can be obtained from by plotting against , expressing clearly the gradient and vertical intercept in terms of and/or . You need not draw this straight line graph.
Show worked solution▾
(a)
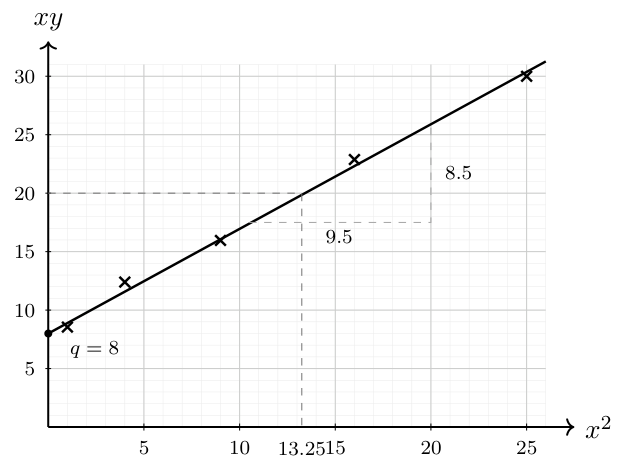
(i) Plot against and draw a straight line through the points , , , , .
(ii)(a)
(ii)(b) from graph,
(b)
Linear Law
The table shows Andy’s marks for his Mathematics practice papers each week.
| Week | 1 | 2 | 3 | 4 | 5 | 6 |
|---|---|---|---|---|---|---|
| Marks | 45 | 59 | 68 | 74 | 71 | 82 |
He believed that these figures can be modelled by the formula , where and are constants, by excluding one datapoint that does not follow the trend.
On the grid below, by ignoring the datapoint that does not follow the trend, plot against and draw a straight line graph.
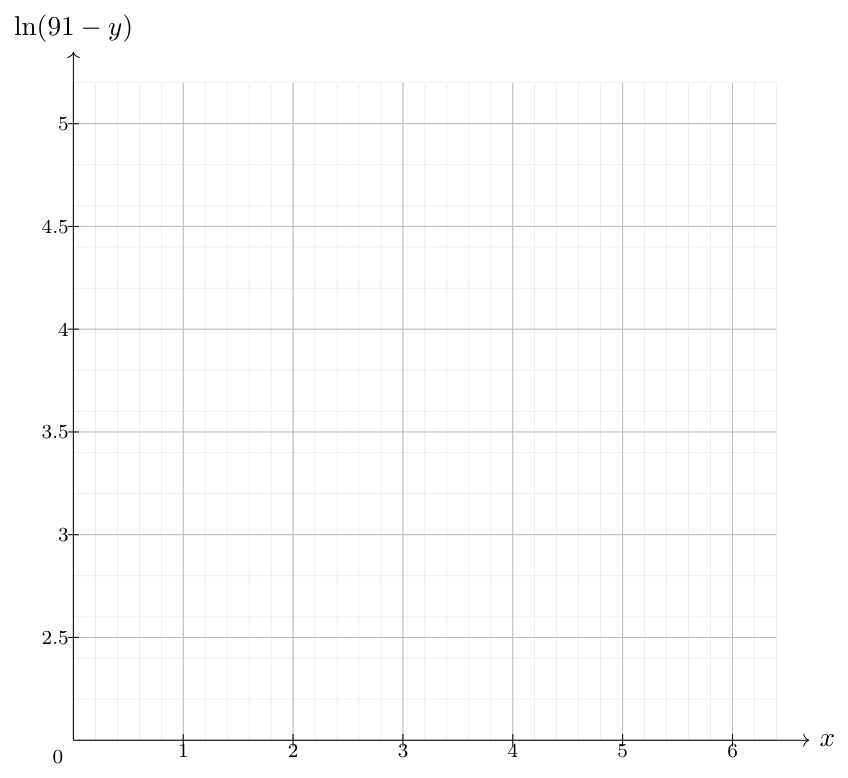
Use the graph to estimate the value of each of the constants and .
Suggest a possible reason why one of the marks does not seem to follow the trend.
From your straight line graph, estimate the expected marks for the datapoint that was excluded.
Show worked solution▾
(a)
(b)
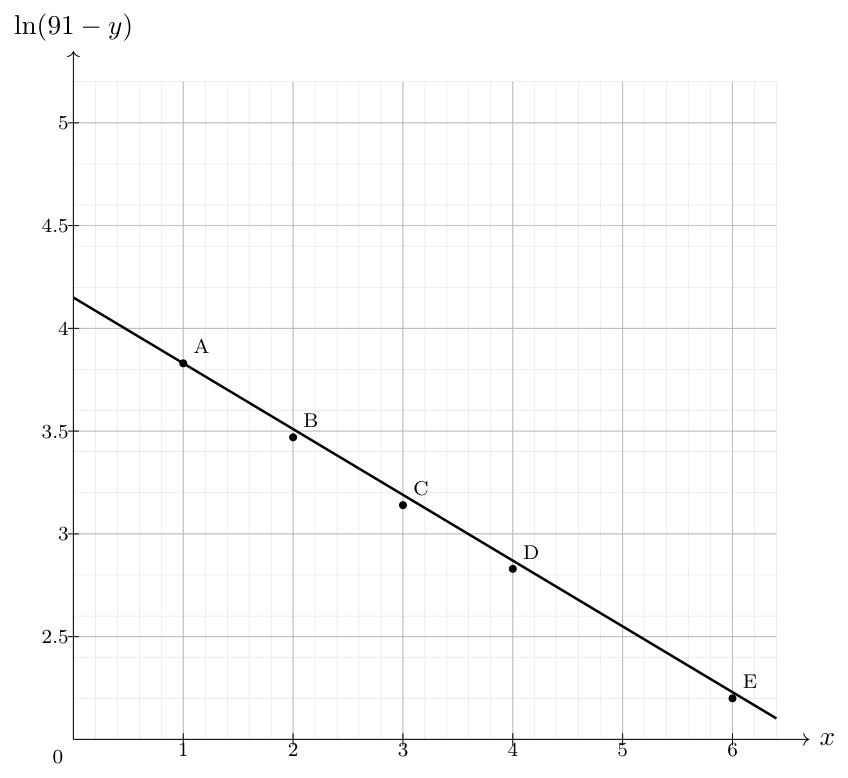
Transforming the equation: Using 2 points on the line and , Reading off the -intercept, we have
The equation of line is By comparing,
(c)
(-) The lower mark on week 5 was likely to be due to a harder paper.
(-) Andy might have been ill.
(d)
The datapoint is
Based on the straight line graph, the reading should be .
The expected marks is
Related A Math topics
Coordinate Geometry of Circles · Basic Trigonometric Identities · Trigonometric Equations & Graphs