
Free practice / Secondary 4 A Maths
Sec 4 A Math: Linear Law, practice questions & worked solutions
Linear Law practice questions selected from 2025 Singapore school A Math prelim papers, each with a full worked solution.
About this topic & key methods
These questions support Secondary 4 and O-Level Additional Mathematics revision.
Attempt each question on paper before opening its worked solution. Keep the source question number when checking against the original paper.
Key methods
- Choose variables that turn a non-linear relationship into a straight line.
- Interpret the gradient and intercept in terms of the original constants.
- Plot transformed data and draw a suitable straight line.
- Use the model to estimate values or identify an anomalous reading.
For guided practice, see our Sec 4 A Maths tuition programme.
Questions & worked solutions
Unless the question specifies otherwise, give numerical answers to 3 significant figures and angles in degrees to 1 decimal place. Angles in radians are stated explicitly.
Linear Law
The table shows experimental values of two variables and . It is known that and are related by the equation , where and are constants.
1 2 3 4 5 2.63 3.89 5.62 8.32 12.02 On the grid provided, plot against and draw a straight line graph to illustrate the information.
Use your graph to estimate the value of and of .
Variables and are related by the formula , where and are constants. Explain clearly how a straight line graph can be drawn to represent this formula. You should state which variables should be plotted on each axis and explain how the values of and can be calculated.
Show worked solution▾
(a)
(i)
| 1 | 2 | 3 | 4 | 5 | |
|---|---|---|---|---|---|
| 2.63 | 3.89 | 5.62 | 8.32 | 12.02 | |
| 0.420 | 0.590 | 0.750 | 0.920 | 1.08 |
Plot against and draw a straight line graph to illustrate the information.
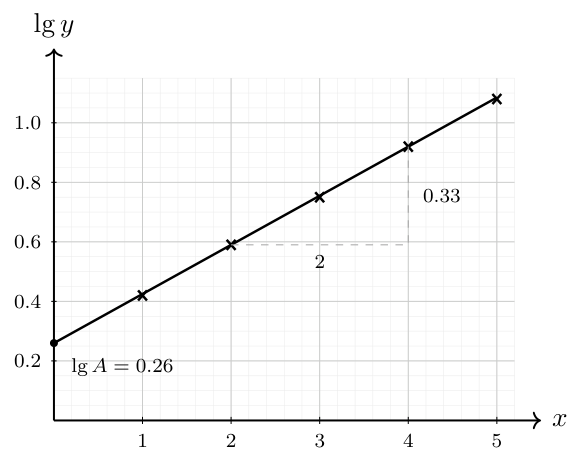
(ii) From the graph, gradient .
(b)
Plot (or ) on the vertical axis against (or ) on the horizontal axis.
Gradient of line (or ).
Vertical intercept of line (or ).
Linear Law
The number, , of a certain type of bacteria increases with time minutes. Recorded values of and are shown in the table below.
| 2 | 4 | 6 | 8 | 10 | |
|---|---|---|---|---|---|
| 3215 | 3446 | 3693 | 3959 | 4243 |
It is known that and are related by the formula , where and are constants.
Explain how a straight line graph can be drawn to represent the formula and draw it for the given data.
Use your graph to estimate
the initial number of bacteria,
the value of ,
the time taken for the number of bacteria to increase by 25%.
Show worked solution▾
Solution 1
(a)
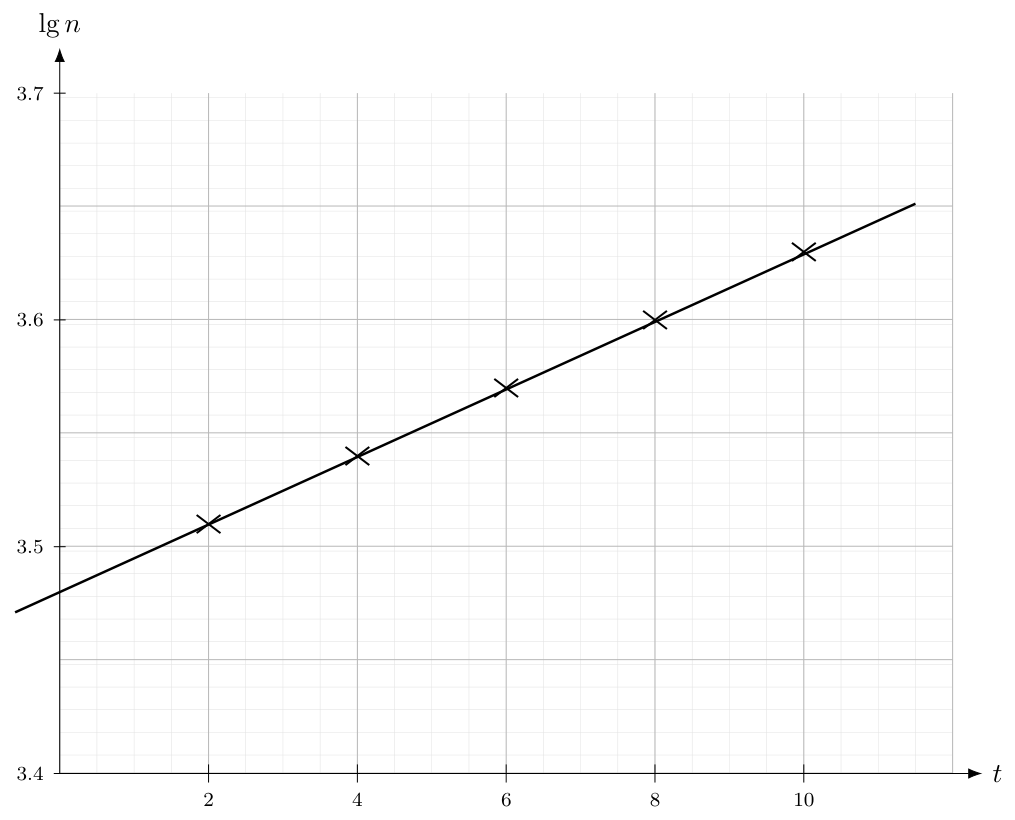
Draw a straight line of against .
| 2 | 4 | 6 | 8 | 10 | |
|---|---|---|---|---|---|
| 3.51 | 3.54 | 3.57 | 3.60 | 3.63 |
Best fit line
(b)
(c)
(d)
Solution 2
(a)
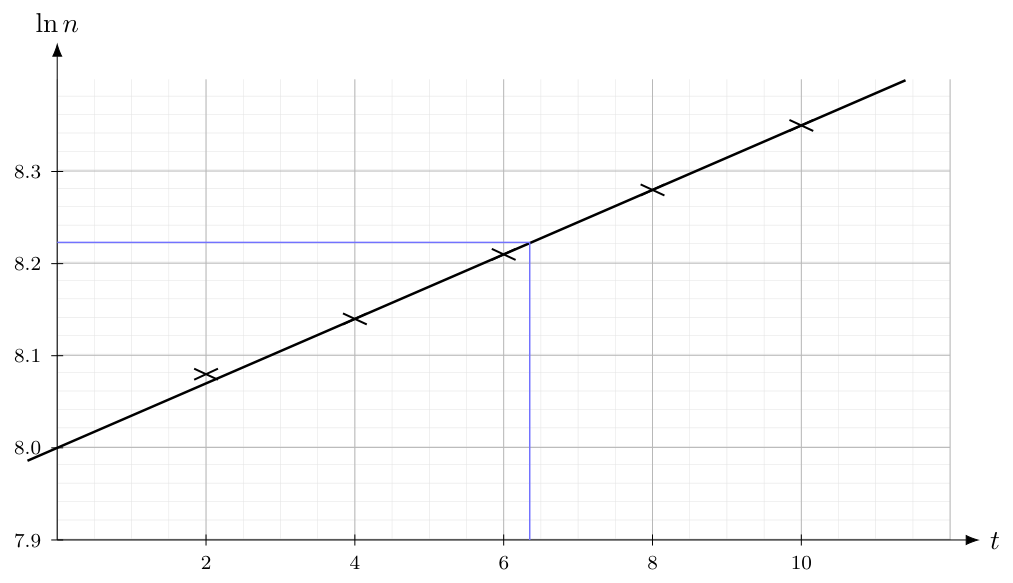
Draw a straight line of against .
| 2 | 4 | 6 | 8 | 10 | |
|---|---|---|---|---|---|
| 8.08 | 8.14 | 8.21 | 8.28 | 8.35 |
Best fit line
(b)
(c)
(d)
Linear Law
The variables and are connected by the equation where and are constants. Explain how a straight line graph can be drawn and state how the values of and could be obtained from the line.
The variables and are such that when values of are plotted against , a straight line is obtained. It is given that when , and when , . Estimate the value of when .
Show worked solution▾
(a)
Vertical intercept Gradient
(b)
When & ; , .
When & ; , . When ,
Linear Law
The diagram shows part of a straight line graph which passes through and .
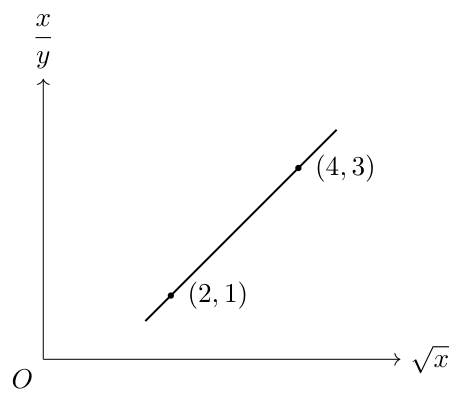
Find the equation of the straight line in the form , where and are constants.
The table below shows the experimental values of two variables and .
1 2 3 4 5 6 63 127 258 510 1000 2100 It is known that and are related by an equation of the form , where and are constants.
On the grid next page, plot against and draw a straight line graph.
Use your graph to estimate the value of and of .
Explain how would you use the graph to find the value of for which .
Show worked solution▾
(a)
equation:
(b)
(i)
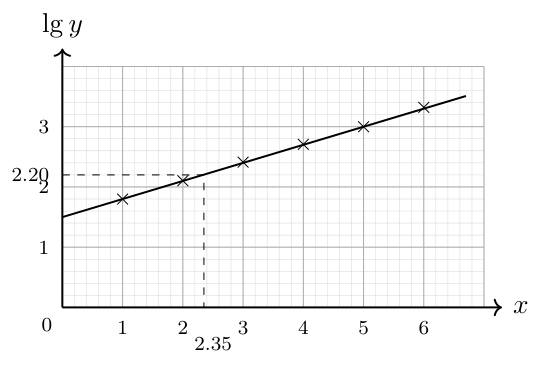
(ii)
(iii) Draw the line and find the -coordinate of the point of intersection.
OR
Linear Law
In an experiment to investigate the relationship between light intensity lux on a surface and distance metres from a light source, a student obtained the following results. One of the values of is incorrect.
| (metres) | 2 | 5 | 10 | 20 | 30 |
|---|---|---|---|---|---|
| (lux) | 875 | 141 | 35 | 4.22 | 3.89 |
It is known that and are related by the equation , where and are constants.
Plot against and draw a straight line graph.

Use your graph to
identify the incorrect reading of and estimate its correct value,
estimate the value of and of .
Using the table of values, explain, with working, how the light intensity changes when the distance from the light source is doubled.
Show worked solution▾
(a)
| 2 | 5 | 10 | 20 | 30 | |
|---|---|---|---|---|---|
| 875 | 141 | 35 | 4.22 | 3.89 | |
| 0.30 | 0.70 | 1.00 | 1.30 | 1.48 | |
| 2.94 | 2.15 | 1.54 | 0.63 | 0.59 |
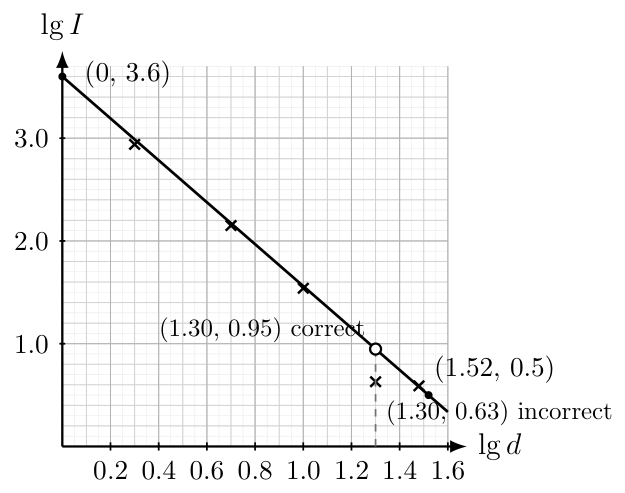
(b)
(i) The incorrect reading of is .
From the graph, the correct reading is .
(ii) From the graph
(c)
From the table, When the distance doubled, the intensity decrease to (one-quarter) of its previous value.
Linear Law
It is believed that the number of views, , of a viral video online after hours are related by the equation , where and are constants.
The table below shows a set of survey results for the variables and .
| Time (hours) | 1 | 2 | 3 | 4 | 5 |
|---|---|---|---|---|---|
| Views (in thousands) | 2.16 | 3.11 | 4.48 | 6.45 | 9.29 |
(a)(i) Explain how a straight line graph can be drawn to represent the formula and draw it for the given data.
(a)(ii) On the grid below, draw the graph and estimate the value of and of .
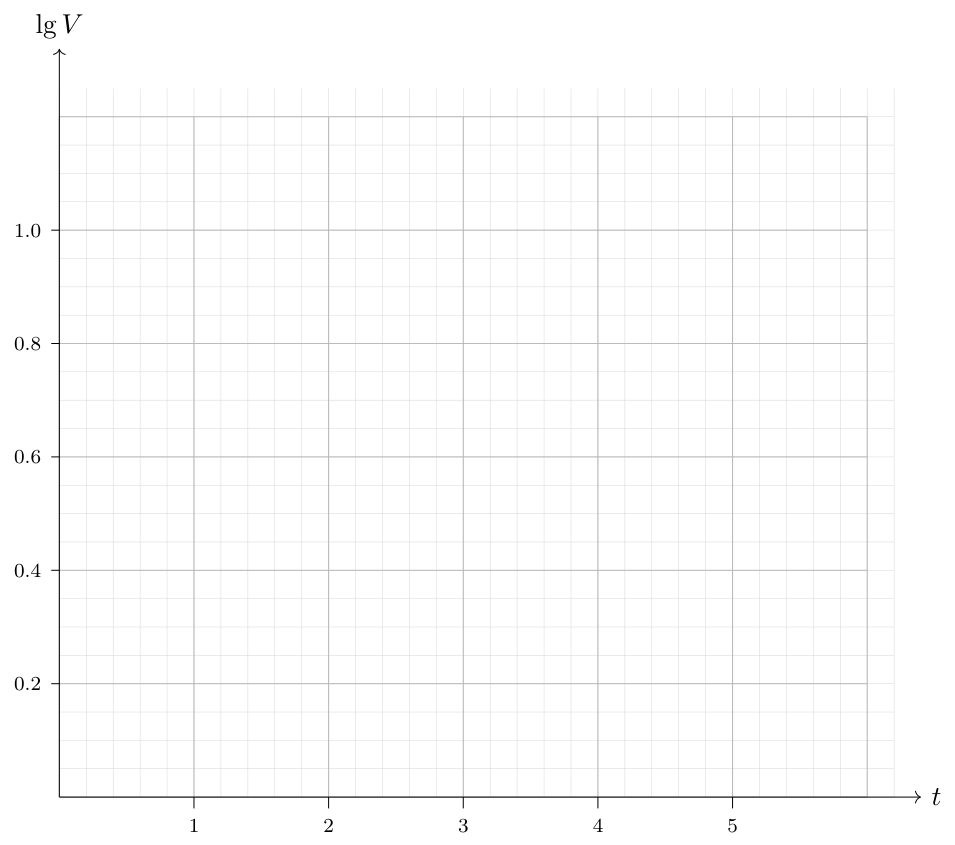
(iii) Using your graph to estimate the number of views when time is 6 hours.
(b) The variables and are related in such a way that when a graph of is plotted against , a straight line graph which passes through the points and is obtained. Express in terms of .
Show worked solution▾
(a)
(i) Plot against
vertical intercept
gradient
| Time (hours) | 1 | 2 | 3 | 4 | 5 |
|---|---|---|---|---|---|
| (in thousands) | 0.33 | 0.49 | 0.65 | 0.81 | 0.97 |
Alternative:
| Time (hours) | 1 | 2 | 3 | 4 | 5 |
|---|---|---|---|---|---|
| (in thousands) | 0.77 | 1.13 | 1.5 | 1.86 | 2.23 |
(ii)
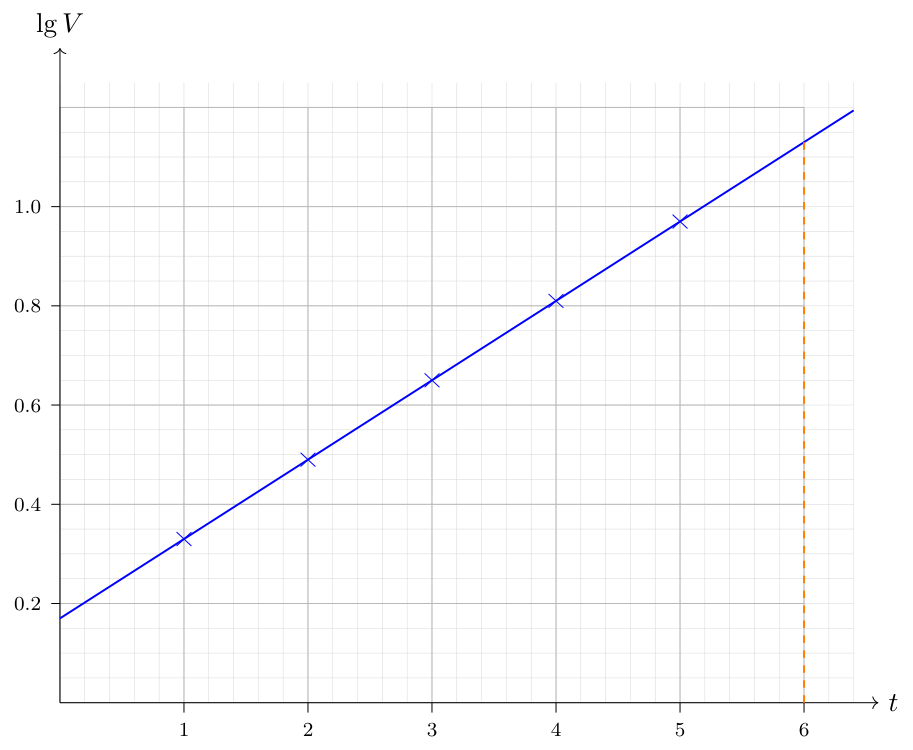
(iii) From the graph, at When hours, there are 13.2 thousands of views
(b)
Related A Math topics
Coordinate Geometry of Circles · Trigonometric Identities & R-Formula · Trigonometric Equations & Graphs