
Sec 1 Maths: Data Handling & Statistics — practice questions & worked solutions
Data-handling and statistics questions from real Singapore Secondary 1 examination papers (2016–2025), each with a full worked solution that shows every step — the way marks are actually awarded.
About this topic & key methods
Data handling is one of the most practical areas of Secondary 1 Mathematics. The questions below cover the full toolkit tested at this level: finding the mean, median and mode from raw lists and frequency tables, reading and completing pictograms, bar graphs, pie charts, line graphs, dot diagrams and histograms, and — increasingly — spotting when a chart is misleading. Many recent papers ask students not just to read a value off a graph, but to judge whether a claim about the data is fair.
The marks in these questions are awarded for clear working and a correct interpretation, not only the final number. Each worked solution below shows the calculation in full and states the reasoning behind every conclusion. For a structured programme that builds these data-handling and statistics skills from the ground up, see our Secondary 1 Maths tuition.
Key methods
- Mean ; from a frequency table, sum each value × its frequency, then divide by the total frequency.
- Median is the middle value when the data is arranged in order (the average of the two middle values if there is an even number of values).
- Mode / modal class is the value (or class interval) with the highest frequency.
- Pictograms: each symbol stands for a fixed number; a part-symbol stands for the matching fraction of that number.
- Bar graphs & line graphs: read values off the vertical axis; a line graph is best for showing a trend over time.
- Pie charts: the whole circle is ; each sector angle is proportional to its share of the total.
- Frequency tables & histograms: group data into class intervals; the modal class has the tallest bar.
- Misleading graphs: a vertical axis that does not start at exaggerates differences between bars.
Questions & worked solutions
Q1 — Mean & median from a frequency table
A group of students were tasked to fold paper-flowers for Teachers’ Day celebration. The following table shows the number of paper-flowers folded in a week by them.
| Number of paper-flowers folded in a week | 10 | 20 | 30 | 40 |
|---|---|---|---|---|
| Number of students | 20 | 5 | 10 |
(i) Find the value of if the mean number of paper-flowers folded in a week is .
(ii) Find the value of if the mean number of paper-flowers folded in a week is .
(iii) Find the maximum value of such that the median number of paper-flowers folded in a week is .
Show worked solution▾
(i)
(ii)
The mean increases as decreases (fewer students folding only ); for mean we need , giving , so .
(iii)
Total students . The median is the average of the two middle values. The values are ordered ( students), (), (), (). For the median to be , both middle positions must fall within the first students. With students the upper middle position must be . Solving gives , so the maximum value of is .
Q2 — Grouped frequency table, modal class & histogram
employees from Company Elite completed a staff satisfaction survey. The scores for the survey are given below.
| 28 | 39 | 32 | 25 | 42 | 18 | 40 | 39 |
| 17 | 26 | 35 | 44 | 19 | 30 | 41 | 13 |
| 38 | 50 | 33 | 31 | 35 | 12 | 22 | 39 |
(i) State the value of and of in the frequency table below.
| Survey score, | ||||
|---|---|---|---|---|
| Frequency | 5 | 10 |
(ii) State the modal class.
(iii) On the grid below, draw a histogram to represent the data.
Show worked solution▾
(i)
Counting scores in each interval. For : . For : .
(ii)
The class with the highest frequency () is . Modal class: .
(iii)
Histogram with bars of heights , , , over the intervals –, –, –, – respectively (equal class widths, bars touching).
Q3 — Dot diagram interpretation
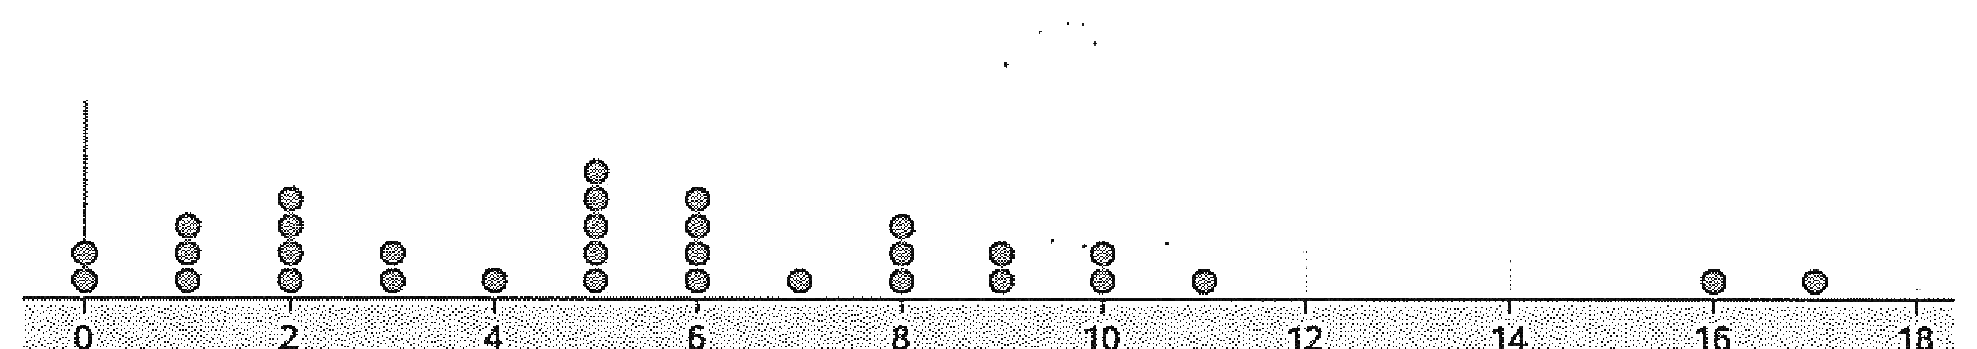
Number of taxi rides (in hundreds)
The dot diagram shows the number of taxi rides taken by residents living in regions in Singapore on a particular Tuesday. Each dot represents a region in Singapore and the number of taxi rides taken are rounded off to the nearest hundred. For example, the two dots on represent two regions that had taxi rides on that Tuesday.
(a) How many regions have at least taxi rides on that Tuesday?
(b) What is the percentage of regions where the number of taxi rides range from to inclusively?
(c) State a possible reason for the regions to have zero taxi rides.
Show worked solution▾
(a) “At least ” means values (hundreds). Counting the dots:
There are regions.
(b) “From to inclusive” means values . Counting the dots:
Percentage:
(c) These regions may be largely industrial, rural or uninhabited (e.g. nature reserves or military areas), so few residents live there and no taxi rides were taken.
Q4 — Line graph, bar graph & misleading axes
The line graph below shows the daily average of the maximum air temperature from January 2023 to June 2023.
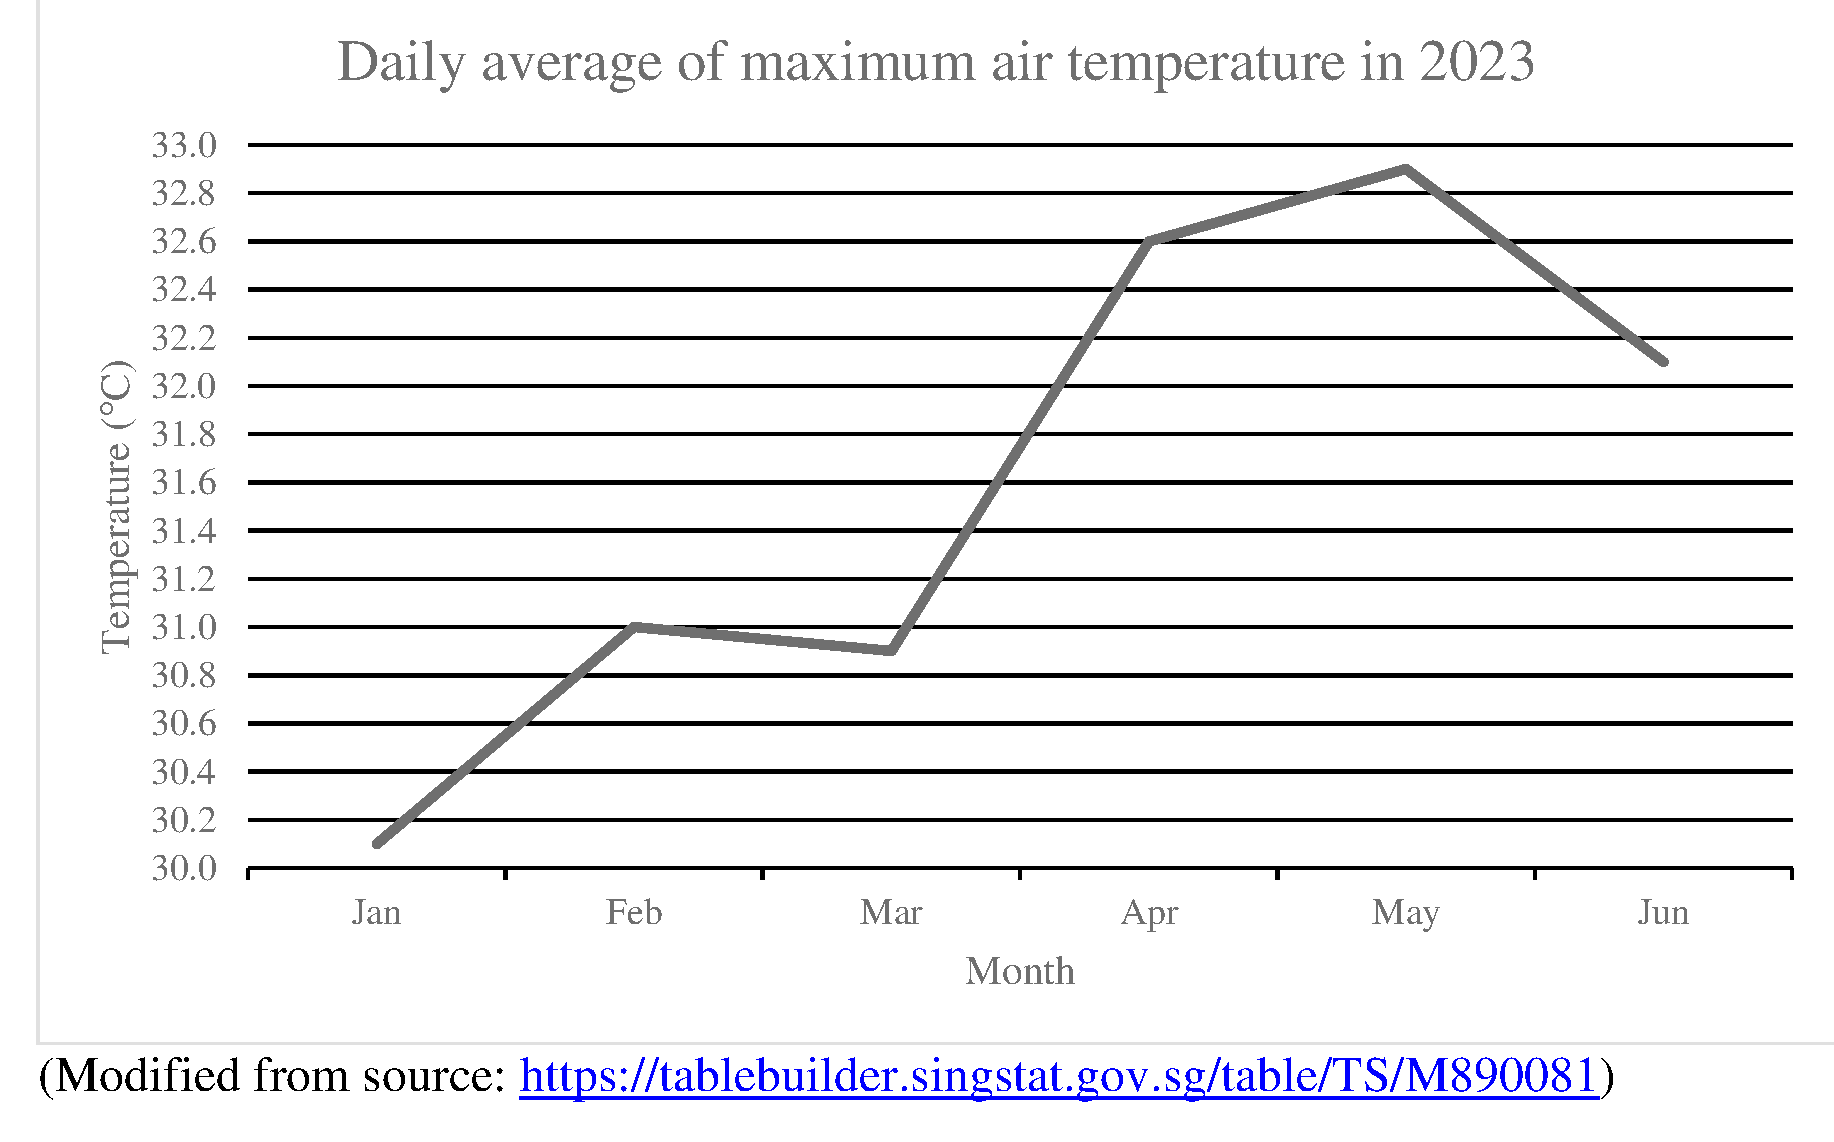
(Modified from source: tablebuilder.singstat.gov.sg)
(a) Between which two months did the temperature have the greatest increase?
(b) Find the temperature difference between January 2023 and February 2023.
The graph below shows the number of rainy days from January 2023 to June 2023.
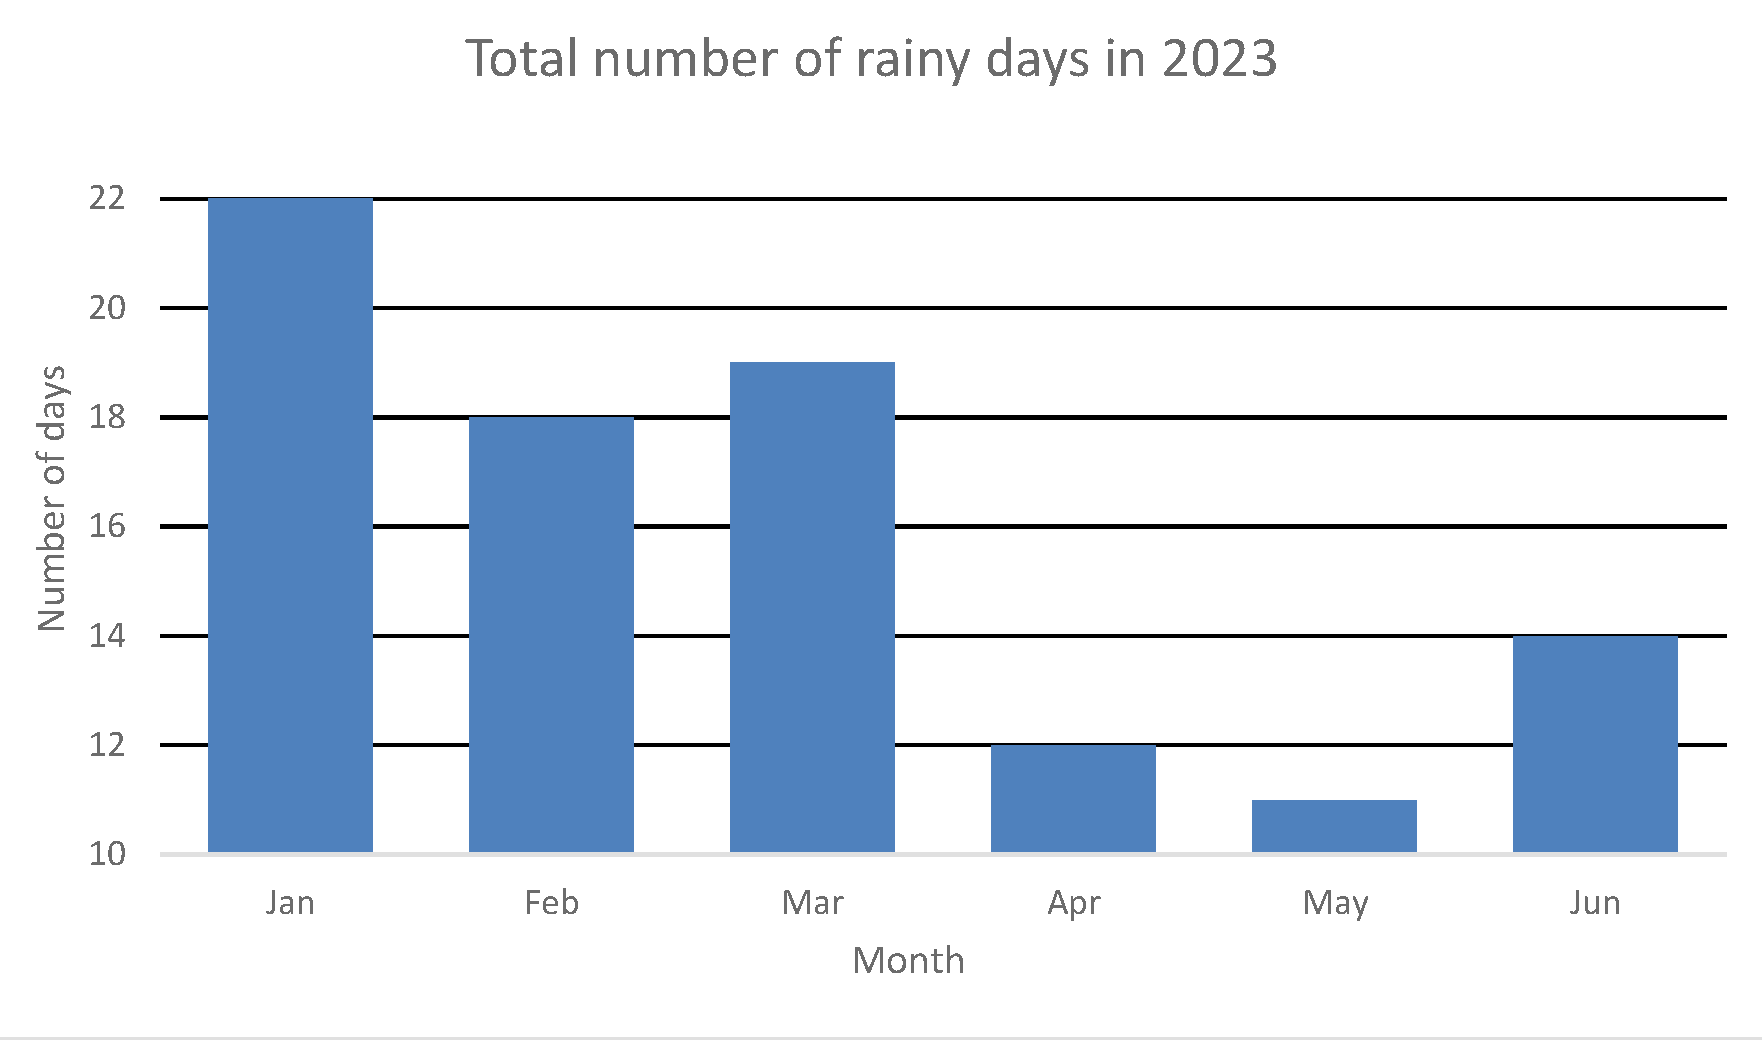
(Modified from source: tablebuilder.singstat.gov.sg)
(c) How many rainy days are there in June 2023?
(d) Given that there is a total of days from January 2023 to June 2023, what percentage of the total days were rainy?
(e) Kaylee claims that the number of rainy days in January 2023 is six times more than the number of rainy days in April 2023 based on the height of the bar graphs. Do you agree with her statement? If not, state one feature of the graph that may lead to this misinterpretation.
(f) Shawn claims that the higher the number of rainy days, the lower the daily average of maximum air temperature for that particular month. Do you agree with his statement? Justify your answer by comparing both statistical diagrams and provide specific examples.
Show worked solution▾
(a) March and April.
(b) Temperature difference (Jan – Feb)
(c) rainy days.
(d) Percentage of rainy days
(e) Disagree. The -axis of the graph starts from instead of , so the height of the bars should not be used to compare the number of rainy days.
(f) Agree. In January 2023 the number of rainy days is the highest and the temperature is the lowest in 2023, while in May 2023 the number of rainy days is the lowest, resulting in the highest maximum temperature. This shows the trend of the number of rainy days is linked to the daily maximum air temperature.
Q5 — Pie chart: find the angle & a quantity
students were surveyed to find out which of the three modes of transport the students prefer to use to travel to school. Their choices are presented in the pie chart shown below.
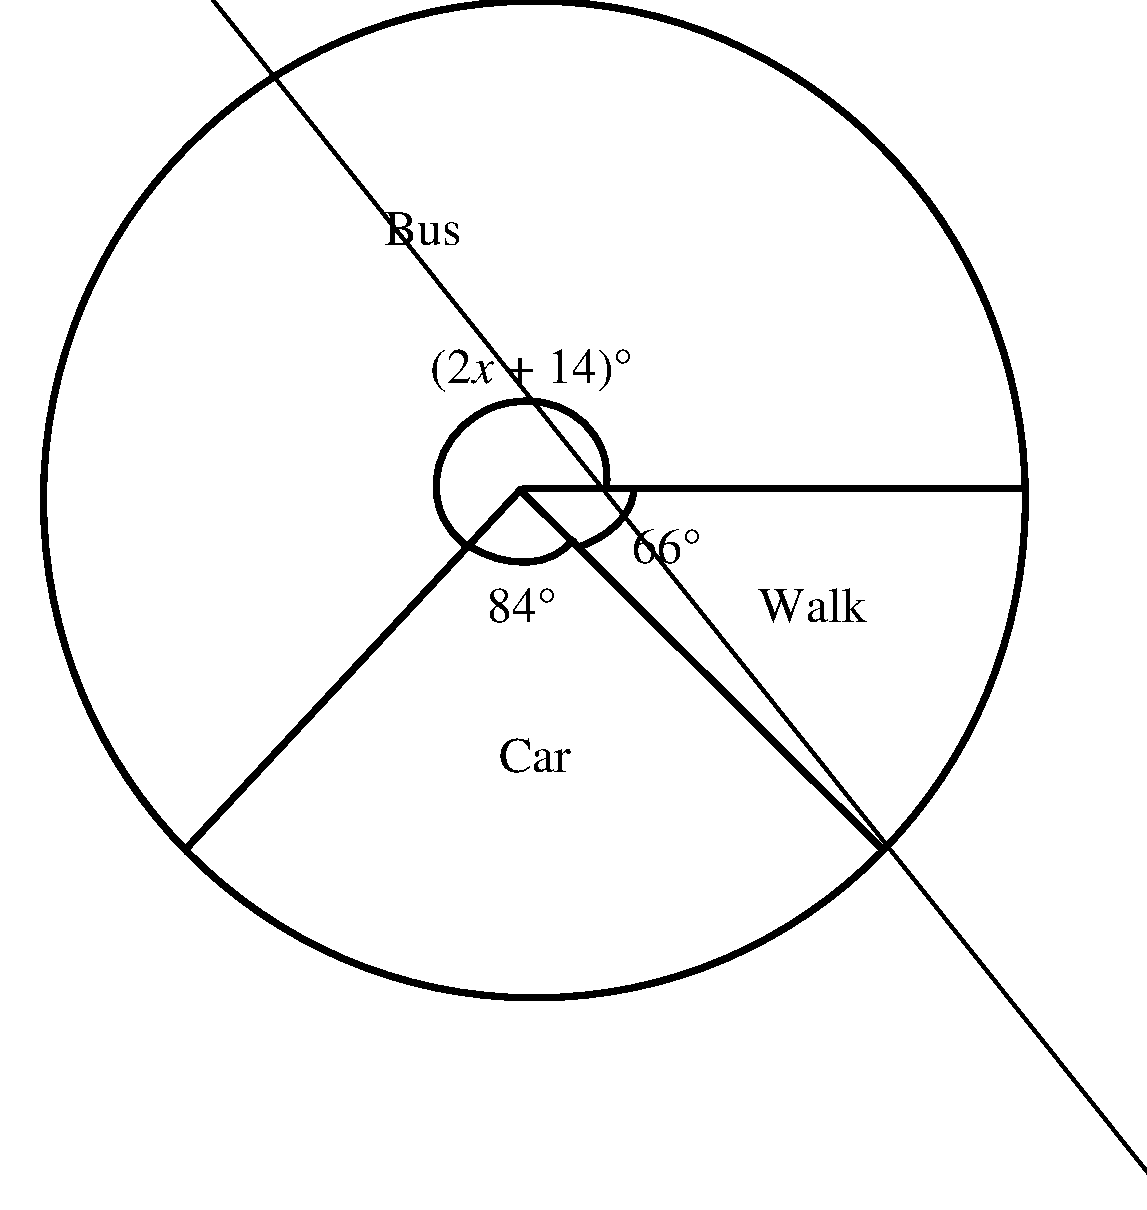
(a) Find the value of .
(b) Find the number of the students who go to school by car.
Show worked solution▾
(a) Value of
Angles at the centre sum to . The sectors are Bus , Walk and Car .
(b) Students by car
Car sector .
Q6 — Line graph: gradient & interpretation
Answer the whole of this question on a sheet of graph paper. Janice’s weight, kg, months after signing up for a slimming program is shown in the table below.
| 2 | 6 | 10 | 16 | |
| 76 | 68 | 60 | 48 |
(a) Using cm to represent month, draw a horizontal -axis for . Using cm to represent kg, draw a vertical -axis for .
(b) Use your graph to find (i) Janice’s weight when she first signed up for the slimming program, (ii) the number of months Janice took to lose kg under the program.
(c) Find the gradient of the graph and explain what the gradient represents.
Show worked solution▾
The points lie on a straight line with gradient
Line equation: .
(b)(i) Weight at signing up
At :
(b)(ii) Months to lose 15 kg
A loss of kg means :
From the graph, about months.
(c) Gradient
Gradient ; it represents Janice’s weight loss of kg per month.
Q7 — Pie chart: percentages & total
The pie chart below shows the distribution of people of different age groups who visited the library on a certain day. Given that of those who visited the library are youth, find
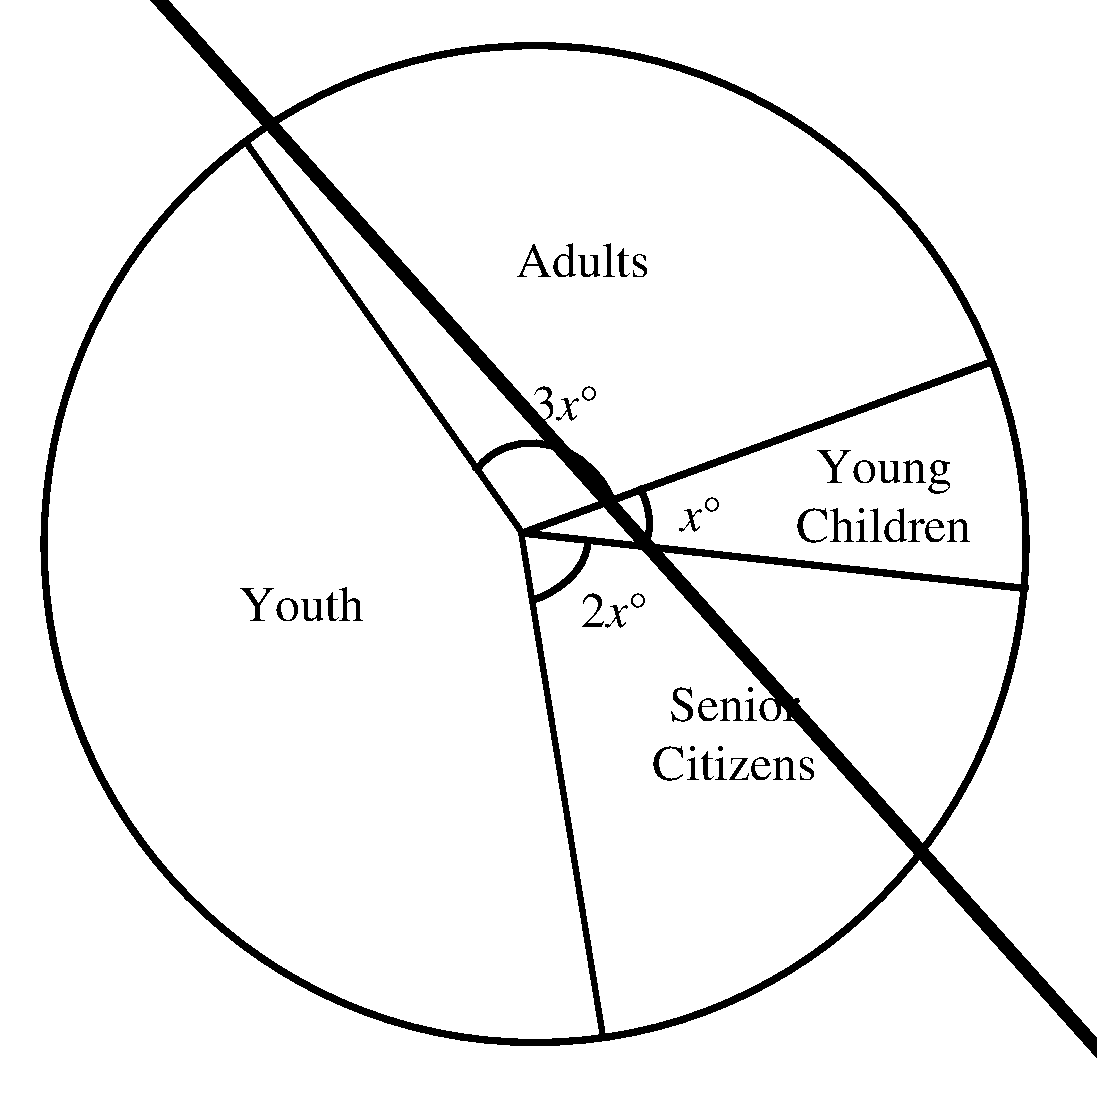
(a) the value of ,
(b) the total number of people who visited the library if the number of adults is more than the number of young children.
Show worked solution▾
(a) Value of
The youth sector of :
The remaining sectors are (Adults), (Young Children) and (Senior Citizens):
(b) Total number of visitors
Adults , Young Children . The difference represents people:
Secondary 1 Maths programme — every method behind these questions, taught step by step.
Frequently asked questions
What is the difference between the mean, median and mode?▾
How do you find a quantity from a pie chart?▾
When is a bar graph misleading?▾
Are these from real exam papers?▾
Related Sec 1 topics