
Sec 2 Maths: Statistics, Mean, Median & Mode, practice questions & worked solutions
Statistics questions from 2025 Singapore Secondary 2 End-of-Year examination papers. They cover dot diagrams, stem-and-leaf diagrams, frequency tables and histograms, and finding and comparing the mean, median and mode, and every question has a full step-by-step worked solution.
About this topic & key methods
In Secondary 2 Mathematics, statistics is about reading data from a diagram or table and summarising it. The questions below use dot diagrams, stem-and-leaf diagrams (including back-to-back diagrams that compare two classes), frequency tables and histograms, and ask for the mean, median and mode, often with an unknown frequency to find.
Most marks are lost by misreading a diagram, so the worked solutions below list the data in order first and count positions carefully before any averaging. When a question asks which group did better, the answer compares one average and quotes both values. For a structured programme covering this topic, see our Sec 2 Maths tuition.
Key definitions and methods
- Mean: ; from a frequency table, .
- Median: the middle value once the data is in order; for values it is in position .
- Mode: the value that occurs most often; a data set can have more than one mode.
- Grouped data: use the mid-value of each class to estimate the mean; the median and mode are then given as classes.
- Stem-and-leaf: always read the key; in a back-to-back diagram the left leaves are read from the stem outwards.
- Outliers: an extreme value pulls the mean towards it but hardly moves the median.
Questions & worked solutions
Describing a dot diagram and finding the mode
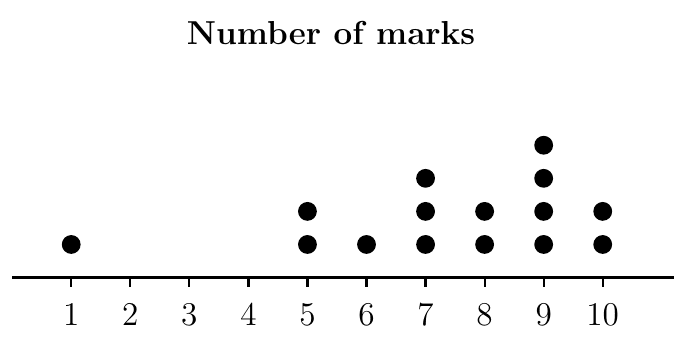
The dot diagram shows the distribution of marks that 15 students from Class A scored in a science quiz. The maximum score is 10 marks.
Describe the dot diagram shown above.
State the modal mark(s).
Show worked solution▾
Reading the dots: mark (1 student), (2), (1), (3), (2), (4), (2). Check: students.
(a)
The marks range from mark to marks. Most of the data is clustered between and marks, with the greatest cluster at marks. The score of mark is an outlier, far below all the other scores.
(b)
The tallest column of dots is at , with students.
Mode and median from a dot diagram, and the effect of an outlier
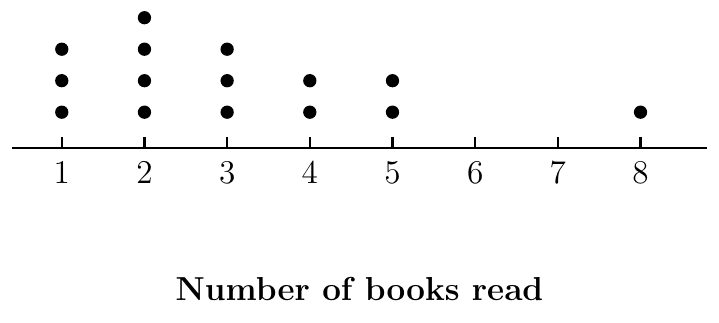
The dot diagram below represents the number of books read by 15 students in a month.
State the modal number of books read.
Find the median number of books read.
When the number of books read by a student is added to the diagram, the median remains the same as that in part (b). Find a possible number of books that this student read.
Explain why finding the mean is not an appropriate average for this data set.
Show worked solution▾
Reading the dots: book (3 students), (4), (3), (2), (2), (1). Total students.
(a)
The tallest column is at books, with students.
(b)
With values the median is the value. Positions to are , positions to are , and positions to are .
(c)
With values the median is the mean of the and values. If the new value is or more, positions to are unchanged and the and values are both , so the median stays . (A new value of or would make the value and the median .)
So the student could have read any number of books that is or more, for example books.
(d)
The value is an outlier. It pulls the mean upwards, so the mean does not represent the typical number of books read as well as the median or mode does.
Reading a stem-and-leaf diagram: percentage, fraction and mode
Students in Class 2A took a Mathematics test. Their scores are represented in the stem and leaf diagram as shown.
| Stem | Leaf |
|---|---|
| 1 | 1 2 4 8 9 9 |
| 2 | 0 1 3 3 7 7 7 8 9 9 |
| 3 | 0 2 4 5 7 8 8 9 9 |
Key : means 19 marks
How many students are there in Class 2A?
Find the percentage of students who scored at least 23 marks.
Write down the fraction of students who scored less than 20 marks.
Find the modal marks scored by the students.
Show worked solution▾
(a)
Count the leaves on each row: .
(b)
The scores below are : that is students. So students scored at least .
(c)
The scores less than are the leaves on the stem .
(d)
The leaf appears three times on the stem ; no other score appears more than twice.
Median and mode from a stem-and-leaf diagram
The stem-and-leaf diagram shows the monthly savings of 20 students.
| Stem | Leaf |
|---|---|
| 0 | 2 3 4 8 |
| 1 | 1 2 4 4 5 |
| 2 | 0 1 1 4 |
| 3 | 1 4 6 7 9 |
| 4 | 2 5 |
Key means $11
Find the median monthly savings.
One of the students claims that the only modal amount students saved was $21.
Is the student correct? Explain your answer.
Show worked solution▾
(a)
With values the median is the mean of the and values. The first values are on stems and , so the value is $20 and the is $21.
The median monthly savings is $20.50.
(b)
No. Both $14 and $21 appear twice, and no other amount appears more than once, so there are two modal amounts: $14 and $21.
Mean from a stem-and-leaf diagram and adding a new value
The stem-and-leaf diagram shows the height of 10 students.
| 15 | 2 6 9 |
| 16 | 0 1 1 1 2 5 |
| 17 | 3 |
Key: means 152 cm
Calculate the mean height of these students.
The height of another student is added to the stem-and-leaf diagram and the mean height of the students increases by 3 cm.
Calculate the height of the student added.
How will the addition of this student's height affect the median?
Show worked solution▾
(a)
The heights are cm.
(b)(i)
The new mean is cm for students. Let the added height be cm.
The student added is cm tall.
(b)(ii)
Before: the median is the mean of the and values, cm. After adding cm at the top, the median is the of values, which is still cm.
The median remains unchanged at cm.
Mode and mean of a frequency table with an unknown
The number of goals scored by a soccer team is recorded.
| Goals scored | 0 | 1 | 2 | 3 | 4 | 5 |
|---|---|---|---|---|---|---|
| Frequency | 2 | 5 | 12 | 4 | 2 |
If the mode is 3, find the largest possible value of .
Find the value of if the mean number of goals is 2.5.
Show worked solution▾
(a)
For goals to be the mode, its frequency must be greater than every other frequency, so . (If there would be two modes, and .)
(b)
Finding an unknown frequency from the mean
The frequency table below shows the number of goals scored in a series of netball matches.
| No. of goals | 0 | 1 | 2 | 3 | 4 | 5 | 6 |
|---|---|---|---|---|---|---|---|
| No. of matches | 2 | 3 | 8 | 4 | 1 | 2 |
If the mean number of goals is 2.68, find the value of .
Show worked solution▾
Total goals and total matches :
Comparing two classes with a back-to-back stem-and-leaf diagram
Two classes of students, Class and Class , each planted sunflower seeds. After 8 weeks, the height of each plant was measured in centimetres. The results are shown in the stem-and-leaf diagram below.
| Leaves for Class | Stem | Leaves for Class |
|---|---|---|
| 2 | 12 | |
| 7 5 3 1 | 13 | 0 1 3 8 |
| 9 7 6 1 0 0 | 14 | 1 2 5 5 9 |
| 6 5 4 3 | 15 | 0 0 0 6 6 7 |
| 9 4 2 2 2 1 | 16 | 1 2 4 6 |
| 0 | 17 | 0 1 |
Key: represents 14.7 cm Key: represents 15.6 cm
Find the difference in the height of the tallest and the shortest plant in Class .
Find the modal height of the plant in Class .
Find the median height of the plant in Class .
A plant is considered healthy if its height is at least 14 cm. Calculate the percentage of plants in Class that is not healthy.
Which class had taller plants? Explain.
Show worked solution▾
Class has plants and Class has plants. Class leaves are read from the stem outwards, so the row means cm.
(a)
(b)
The leaf appears three times on the stem for Class , more than any other height.
(c)
Class has plants, so the median is the value. The first values are on stems and ; the and values are both .
(d)
Not healthy means shorter than cm: the plants on stem .
(e)
Compare the medians. Class has plants, so its median is the mean of the and values, and :
Class had taller plants, because its median height ( cm) is higher than that of Class ( cm).
Back-to-back stem-and-leaf: percentage, mode, median and moderation
The back-to-back stem-and-leaf diagram represents the scores of the students in Class A and Class B for the same examination. In each class, 20 students sat for the examination.
| Class | Class | |
|---|---|---|
| 9 3 | 4 | 0 1 2 |
| 8 6 | 5 | 2 4 4 |
| 8 7 2 2 1 0 | 6 | |
| 9 2 2 2 1 | 7 | 3 5 5 6 7 |
| 8 1 | 8 | 0 1 3 4 |
| 5 4 0 | 9 | 1 3 6 6 6 |
Key (Class A): means 43 marks Key (Class B): means 40 marks
Find the percentage of students in Class A who scored at least 75 marks.
Find the modal mark for Class A.
Find the median mark of Class B.
Which class performed better in the examination? Explain your answer.
The teacher moderated the test by adding 2 marks to all students in Class A and Class B. Explain how the mode and median of the two classes have changed.
Show worked solution▾
In order, Class A: .
Class B: .
(a)
Class A scores of at least : , which is students.
(b)
appears three times in Class A, more than any other mark.
(c)
The median of values is the mean of the and values.
(d)
Class B performed better, because its median mark () is higher than the median mark of Class A ().
(e)
Adding marks to every score shifts every value up by without changing the order. So for both classes the mode and the median each increase by marks: Class A mode , median ; Class B mode , median .
Median, mode and mean from a back-to-back stem-and-leaf diagram
Two classes of students sat for a Mathematics test. Their scores are shown below in the stem-and-leave diagram.
| Class | Class | |
|---|---|---|
| 7 1 0 | 5 | 2 5 |
| 8 7 6 5 5 | 6 | 4 5 6 |
| 5 5 2 2 2 2 | 7 | 1 2 2 4 5 9 |
| 4 2 2 1 | 8 | 2 3 3 5 7 |
| 7 3 | 9 | 0 2 5 5 |
Key: means 50 marks for a student in Class and 52 marks for a student in Class
Find the median score for Class .
Find the modal score of the test for class .
Find the mean score of class .
Which class did better? Explain.
Show worked solution▾
Each class has students. In order, Class : .
(a)
(b)
In Class the leaf appears four times on the stem .
(c)
(d)
Class : .
Class did better, because its mean score () is higher than the mean score of Class ().
Note: the school's marking scheme gives the Class mean as ; the diagram as printed gives . The conclusion is the same.
Finding an unknown leaf from equal medians
The stem-and-leaf diagram shows the distribution of masses, in grams, of 29 Grade A peaches and 30 Grade B peaches.
| Grade A | Grade B | |
|---|---|---|
| 9 8 8 8 | 34 | 3 4 6 7 7 9 |
| 7 6 6 5 1 1 0 0 | 35 | 1 3 3 5 6 6 8 9 |
| 9 7 7 6 6 4 4 3 3 2 1 0 | 36 | 0 4 6 6 6 6 8 8 9 9 |
| 9 6 2 2 | 37 | 0 1 1 2 2 |
| 3 | 38 |
Key: means 348 grams Key: means 343 grams
Write down the modal mass of Grade A peaches.
The median mass for both grades of peaches was the same. Write down the value of .
Due to an error, all the recorded masses were 10g less. Explain how the recorded median mass had been affected.
Show worked solution▾
(a)
For Grade A, the leaf appears three times on the stem ; no other mass appears more than twice.
(b)
Grade A has peaches, so its median is the value. Stems and hold values; the stem read from the stem outwards is , so the value is g.
Grade B has peaches, so its median is the mean of the and values. Stems and hold values, so these are and .
(c)
Subtracting g from every mass keeps the masses in the same order, so the middle value is also g less. The recorded median mass was g less than the true median.
Grouped frequency table and probability
The timings of 30 runners who completed a 3.5 km run were recorded.
| 12.9 | 15 | 20.7 | 39 | 13.6 | 35 |
| 42.1 | 31 | 35 | 36.8 | 22 | 29.8 |
| 33.6 | 35.7 | 14.4 | 46 | 27.7 | 23.4 |
| 34 | 15.8 | 43.6 | 35 | 15.8 | 40 |
| 37.2 | 20.5 | 27 | 43.1 | 48.8 | 27 |
Complete the frequency table below.
| Time ( minutes) | Frequency |
|---|---|
| 8 | |
| 5 |
A runner was chosen at random. Find the probability that the runner's timing was
not between 20 to 30 minutes inclusive,
more than 30 minutes.
Show worked solution▾
(a)
Tally the timings. For : , which is . For : , which is (note that belongs here, since ).
| Time ( minutes) | Frequency |
|---|---|
| 6 | |
| 8 | |
| 11 | |
| 5 |
Check: .
(b)(i)
No timing is exactly or , so runners were between and minutes inclusive.
(b)(ii)
Estimated mean and histogram for grouped data
The number of books read by a group of students in a month are recorded in the table below.
| Number of books () | Frequency |
|---|---|
| 10 | |
| 14 | |
| 8 | |
| 6 | |
| 4 |
Calculate an estimate of the mean number of books read in a month.
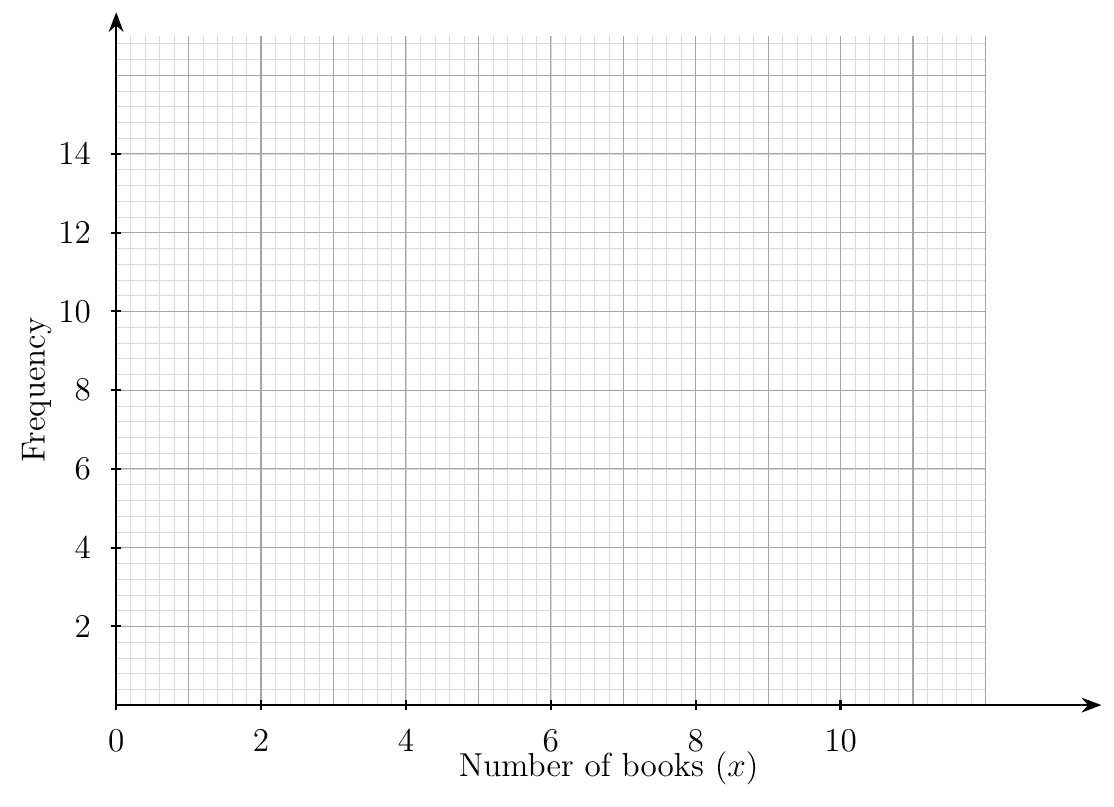
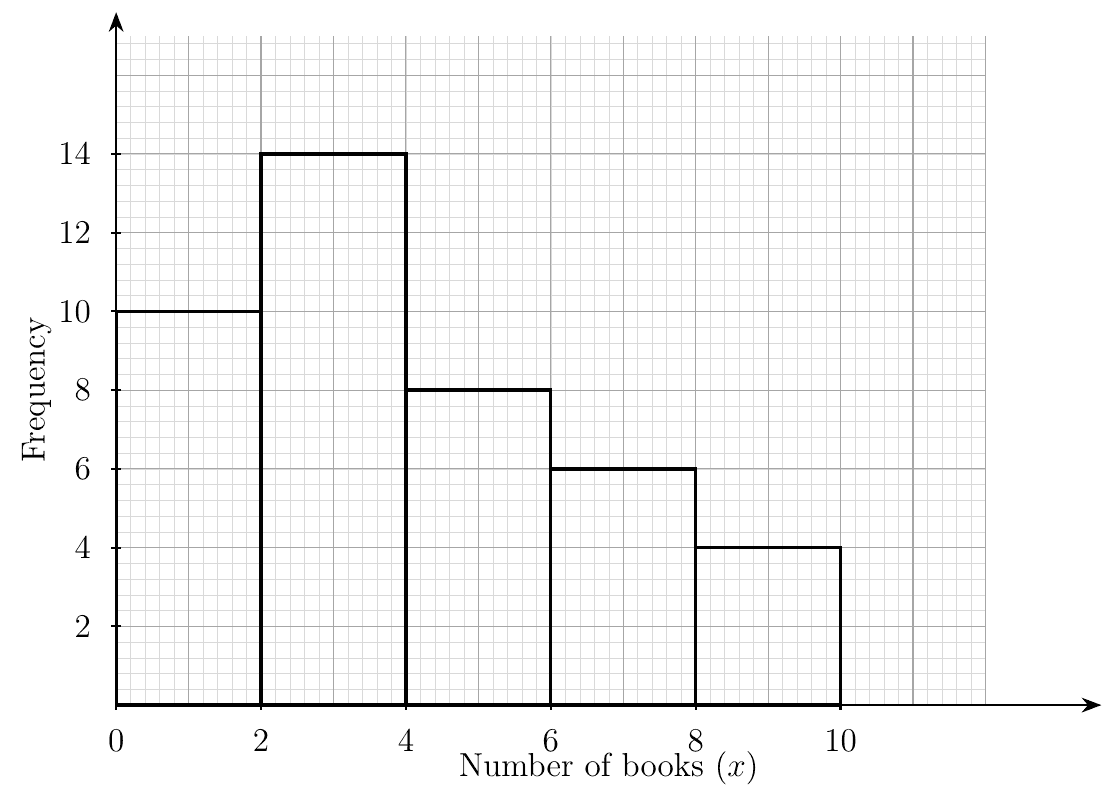
Draw a histogram to illustrate the data.
A student read 4 books in a month. In which class interval from the frequency table would this number be placed?
Calculate the probability that a student reads more than 6 books.
Show worked solution▾
(a)
Use the mid-value of each class: .
(b)
The classes all have width , so each bar’s height is its frequency: , with no gaps between bars.
(c)
satisfies , so it belongs to the class .
(d)
Estimated mean, median class and probability from grouped data
A survey was conducted to find out how much money adults spend on their lunch on average per day. The results are shown in the table below.
| Amount of money spend ($) | Frequency |
|---|---|
| 30 | |
| 48 | |
| 54 | |
| 31 | |
| 20 | |
| 7 |
Calculate an estimated mean amount of money spent per day. Give your answer to the nearest cent.
What is the median amount of money spent per day on lunch?
An adult was chosen at random. Find the probability that this person spends $6 or more for lunch per day.
Show worked solution▾
(a)
Use the mid-values . The total frequency is .
The estimated mean is $5.42 (to the nearest cent).
(b)
With adults the median lies between the and values. The cumulative frequencies are , , , so both values lie in the third class.
The median amount lies in the class $5 $6.
(c)
Median and mean in a profit decision
Jason works part-time at a bubble tea shop and collected data about the number of drinks sold during different hours on a Saturday. He wants to analyse the data to help his manager optimise staff deployment.
Here are the number of drinks sold each hour from 11 am to 9 pm:
15, 18, 25, 42, 38, 42, 36, 42, 28, 25
Calculate the median number of drinks sold per hour.
The manager defines peak hours as times when the number of drinks sold are greater the median. Calculate the mean number of drinks sold during peak hours.
During peak hours, each drink generates a profit of $3 to the bubble tea shop. Jason estimates that an additional staff member can increase the number of drinks sold by 25% during peak hours. Every staff member earns $15 per hour.
Would you recommend Jason proposing to the manager to hire an additional staff member during peak hours? Justify your answer using appropriate calculations.
Show worked solution▾
(a)(i)
In order: . With values the median is the mean of the and values.
(a)(ii)
Peak hours are the hours with more than drinks: .
(b)
There are peak hours with drinks sold in total. Compare the extra profit from the extra drinks with the extra staff cost.
Yes. Hiring an additional staff member during peak hours brings in $150 of extra profit for a cost of $75, a net gain of $75 (or $15 per peak hour), so the proposal is worth making.