Free practice / Secondary 4 E Maths
Sec 4 E Maths: Statistics and Data Analysis, practice questions & worked solutions
Statistics questions selected from 2023 to 2025 Singapore school E Maths prelim papers, each with the school’s full worked solution.
About this topic & key methods
Statistics in Sec 3 and Sec 4 E Maths covers reading and judging diagrams, averages, standard deviation, and comparing distributions with cumulative frequency curves and box plots. The nine Paper 1 questions here are short, single-skill items; the three Paper 2 questions combine several of these skills in one context.
Attempt each question on paper before opening its worked solution. The solutions are the schools’ own marking schemes, so some steps are brief.
Key methods for statistics
- Grouped data: use class midpoints, and
- Adding to every value moves the mean by and leaves the standard deviation unchanged; multiplying by multiplies both by
- Median and quartiles from ordered data or a stem and leaf diagram; IQR
- On a cumulative frequency curve read , median and at , and , and the th percentile at
- Compare two distributions with one comment on the average (median or mean) and one on the spread (IQR or standard deviation), quoting figures
- Pie chart sector angle
- Spot misleading diagrams: truncated axes, unequal widths or areas, biased titles
For lessons that build these methods week by week, see our E Maths tuition for Sec 3 and Sec 4.
Statistics and Data Analysis questions with worked solutions
Unless the question specifies otherwise, give non-exact answers to 3 significant figures and angles in degrees to 1 decimal place.
Misleading bar chart with a truncated axis, CHIJ St. Nicholas Girls’ School, 2023 Prelim P1 Q10
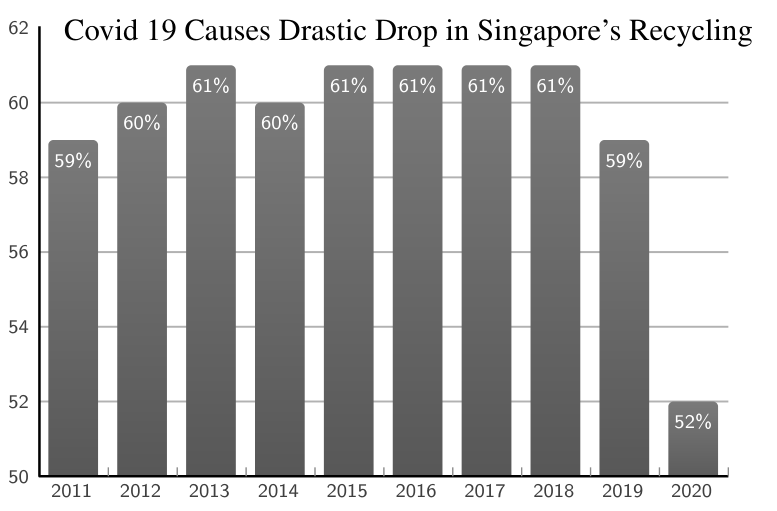
State one aspect of the graph that may be misleading and explain how this may lead to a misinterpretation of the graph. [2]
Show worked solution▾
Vertical axis starts from 50 instead of 0.
It leads to misinterpretation because it exaggerates the differences between the years.
The title is biased. (Or the title uses loaded words ``drastic drop'').
It leads to misinterpretation because it does not allow the reader to make own judgement.
Answer: The vertical axis starts at , not , so the fall from to looks far bigger than it is; the title ``Drastic Drop'' is also biased.
Pie chart angles and frequencies, Fairfield Methodist School (Secondary), 2023 Prelim P1 Q4
The pie chart below shows the age groups (in years) of 240 adults who took part in a triathlon.
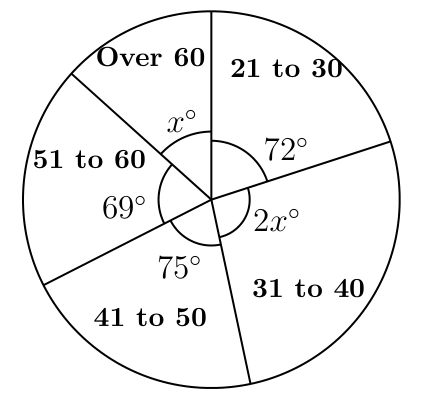
Find the value of . [1]
Calculate the number of adults aged 41 to 50 years old who took part in the triathlon. [1]
Show worked solution▾
(a)
(b)
No. of adults
Answer: (a) (b) adults
Standard deviation after adding and multiplying, St Joseph’s Institution, 2025 Prelim P1 Q14
Two sets of test scores are shown below.
Without any calculation, explain which set has the larger standard deviation? [2]
Set C has a standard deviation of 7.
Every value is increased by 10, then multiplied by 2.
Find the new standard deviation. [1]
Show worked solution▾
(a)
Set B has the larger standard deviation. All values in Set A are the same, so there is no spread and the standard deviation is 0. Set B's values are spread out around the mean, so its standard deviation is greater than 0.
(b)
14
Adding 10 to each score does not change the standard deviation, so it remains 7. Multiplying every score by 2 doubles the standard deviation.
Answer:
Finding data from the mean, median and mode, Hua Yi Secondary School, 2024 Prelim P1 Q8
Isha has written down five numbers.
The mean of these numbers is 13.2, the median is 12 and the mode is 7.
The largest number is three times the smallest number.
Find the five numbers in ascending order. [2]
Show worked solution▾
Answer:
Grouped mean and standard deviation of salaries, Dunman Secondary School, 2025 Prelim P1 Q22
The table below summarises the monthly salary of 100 workers in a company.

Calculate an estimate of the mean monthly salary. [1]
Calculate an estimate of the standard deviation of the monthly salary. [1]
A financial crisis occurred and there was a rebalancing of salaries to support some workers.
The rebalancing is as follows:Workers earning less than $5000 will receive an increment of $300.
Workers earning between $5000 (inclusive) and $5500 (exclusive) will keep their current salary.
Workers earning $5500 or more will receive a pay cut of $300.
Explain how this rebalancing affects the mean and the standard deviation of the salaries. [2]
Show worked solution▾
(a)
(b)
Standard deviation = $637.87 or $638
(c)
Mean remains unchanged, standard deviation becomes smaller
Answer: (a) (b) (c) the mean is unchanged and the standard deviation becomes smaller
Median and standard deviation from a stem and leaf diagram, Xinmin Secondary School, 2024 Prelim P1 Q19
The mass of some crystals were measured and the results are shown in the stem-and-leaf diagram.
| 1 | 5 | 7 | 7 | 8 |
| 2 | 1 | 3 | ||
| 3 | 2 | 2 | 5 | 8 |
| 4 | 0 | 1 |
Key 2 4 means 240 g
Find the median mass. [1]
Find the standard deviation of the mass. [1]
A crystal is chosen at random. Calculate the probability of the crystal having a mass of at least 350 g. [1]
It was discovered that the mass has been measured incorrectly. The correct mass were all 20 g more than those recorded.
Explain how the median and standard deviation of the mass have been affected by this error. [2]
Show worked solution▾
(a)
(b)
g
(c)
(d)
The median mass should be 20 g more, which is 295 g, but the standard deviation would remain unchanged.
Answer: (a) g (b) g (c) (d) the median increases by g to g and the standard deviation is unchanged
Solving for an unknown from the mean and comparing distributions, Yio Chu Kang Secondary School, 2025 Prelim P1 Q21
The list shows information about the total number of hours Kalea studied each week for 7 weeks.
The mean number of hours she studied per week is 16 hours.
Show that . [3]
The standard deviation for Kalea's data is 7.41.
For the same 7 weeks, Kalea's brother also studied each week.
For his data, the mean is 13 hours and the standard deviation is 5.23.By commenting on (1.) the means and (2.) the standard deviations, compare the distributions for the number of hours studied by Kalea and her brother. [2]
Show worked solution▾
(a)
(b)
1. Kalea studied longer, on average, as her mean is higher.
2. Kalea's studying hour is more widespread as her SD is higher.
Answer:
Unknown frequency from a given standard deviation, Anglican High School, 2025 Prelim P1 Q13
The table shows the number of books read by some students last month.

Show that the mean value of the data is 2. [2]
The standard deviation of the data is 1. Find the value of . [3]
Show worked solution▾
(a)
(b)
Answer: (b)
Back to back stem and leaf diagram with unknown leaves, Ahmad Ibrahim Secondary School, 2023 Prelim P1 Q23
The back-to-back stem-and-leaf diagram shows the times, in minutes taken by two groups of students to complete a task.
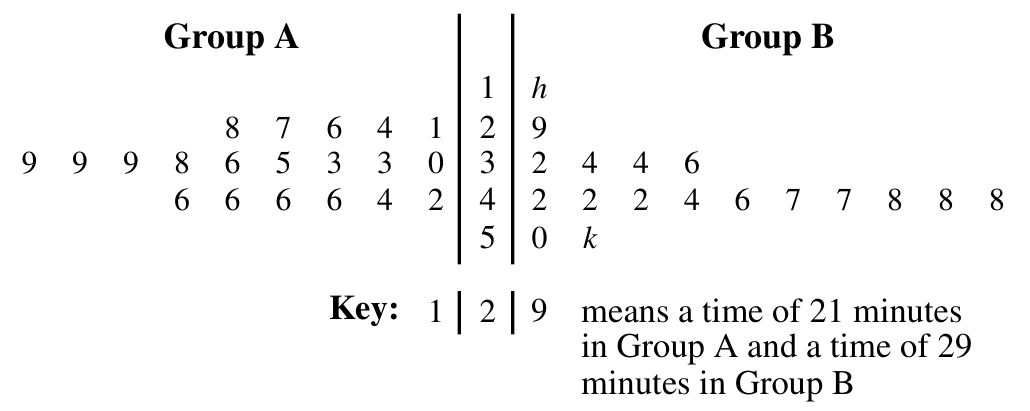
Find the modal time for group A. [1]
Find the median time for group A. [1]
The range of time for group B is 45 minutes.
The mean time for group B is 41 minutes.
By forming two equations, find the value of and of . [4]
Show worked solution▾
(a)
46 minutes
(b)
37 minutes
(c)
Let be the shortest time possible and be the longest time possible for Group B,
since mean is 41 minutes
:
Answer: (a) 46 min (b) 37 min (c) ,
Missing frequencies from a quartile, then mean and standard deviation, Bukit View Secondary School, 2024 Prelim P2 Q7
A class of 40 Secondary Four students were asked how much time they have spent on social media in the last week.
The results are shown in the table.

The lower quartile of the time spent on social media was 20 hours.
Show that . [2]
Hence state the value of . [1]
Estimate the mean number of hours spent by the students. [2]
Estimate the standard deviation. [1]
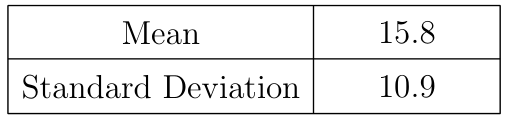
A class of 40 Secondary Three students were asked how much time (in hours) they have spent on social media in the last week.
The results are summarised in the table.
(v)
Make two comparisons between the number of hours spent on social media by the Secondary Three students and by the Secondary Four students. Use the data to support your answers. [2]
Show worked solution▾
(i)
Since lower quartile hours,
of 40 10 students spent 20 hours of less
(ii)
(iii)
(iv)
(v)
The Sec 4 students have a higher mean time spent on social media, this indicates that the Sec 4 students generally spend more time of social media compared to Sec 3 students.
Both cohorts have the same standard deviation, this means their time spent is equally spread out/equal(same) consistency.
Answer: (i) (ii) (iii) (iv)
Percentiles from a cumulative frequency curve and a box plot, Anglo-Chinese School (Barker Road), 2023 Prelim P2 Q4
The cumulative frequency curve shows the distribution of the scores of a Geography test (Test 1) taken by 80 students. Test 1 was marked out of 60.
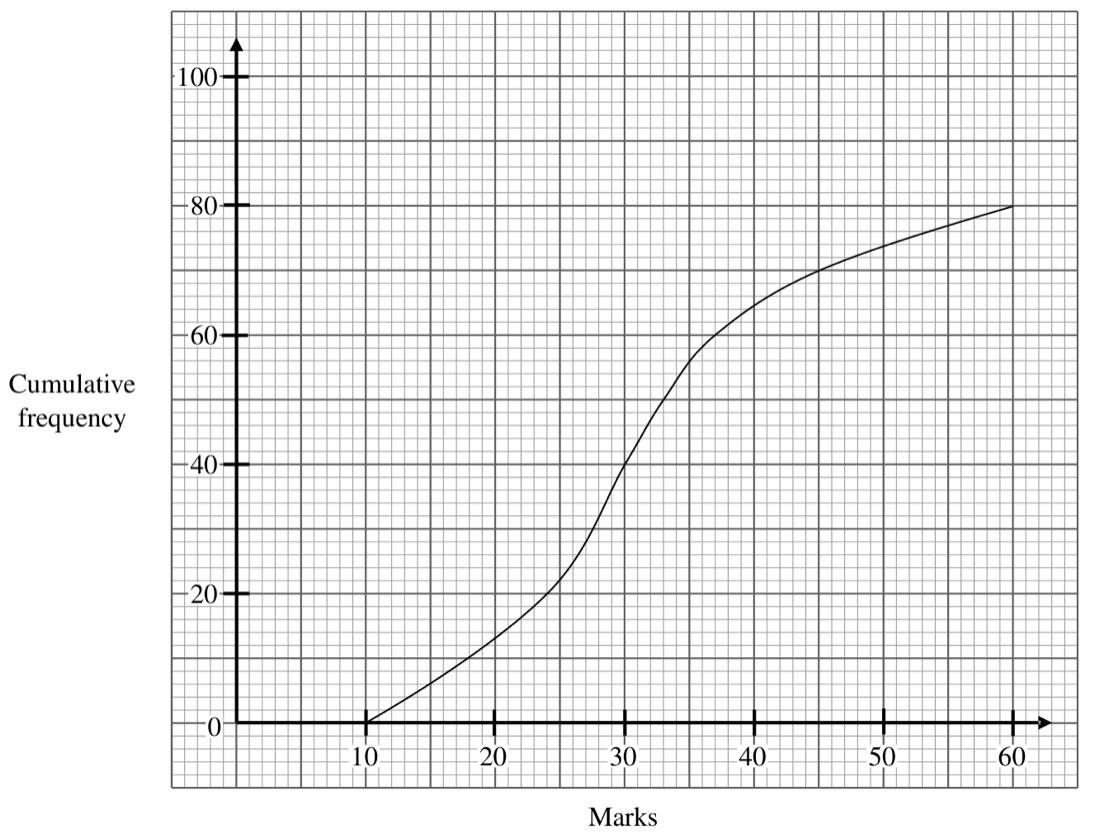
Use the curve to estimate
the 40 percentile for Test 1, [1]
the interquartile range for Test 1. [2]
This box-and-whisker plot represents the distribution of the scores of the same group of students for another Geography test (Test 2). Test 2 was marked out of 60.
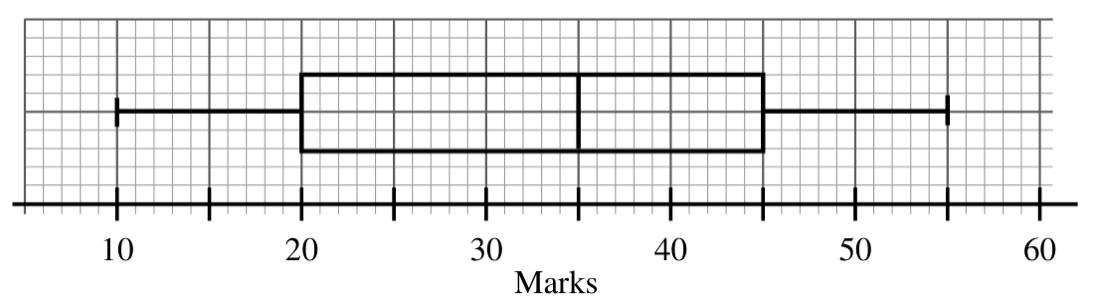
Find the median mark for Test 2. [1]
To obtain a distinction for Test 1 and Test 2, a student needs to score at least marks.
If 12.5% of the students scored distinction for Test 1, find . [2]``There is a higher proportion of students who scored distinction for Test 1.''
Do you agree with this statement? Give a reason for your answer. [1]
The table below summarises the speeds of 95 cars on a stretch of road.

Calculate an estimate of
the mean speed, [1]
the standard deviation. [1]
Show worked solution▾
(a)(i)(i)
(a)(i)(ii)
(a)(ii)
(a)(iii)
marks
(a)(iv)
Disagree. Test 1, 12.5% scored distinction, Test 2, 25 % scored distinction. High proportion of students scored distinction in Test 2.
(b)(i)
(b)(ii)
Answer: (a)(i)(a) (b) (a)(ii) (a)(iii) marks (a)(iv) disagree: scored a distinction in Test 2 (b)(i) km/h (b)(ii) km/h
Comparing a cumulative frequency curve with a box plot, Naval Base Secondary School, 2024 Prelim P2 Q3
In February 2021, a survey was carried out to find the number of days 500 patients stayed at a hospital. The graph shows the cumulative frequency curve for the data collected.
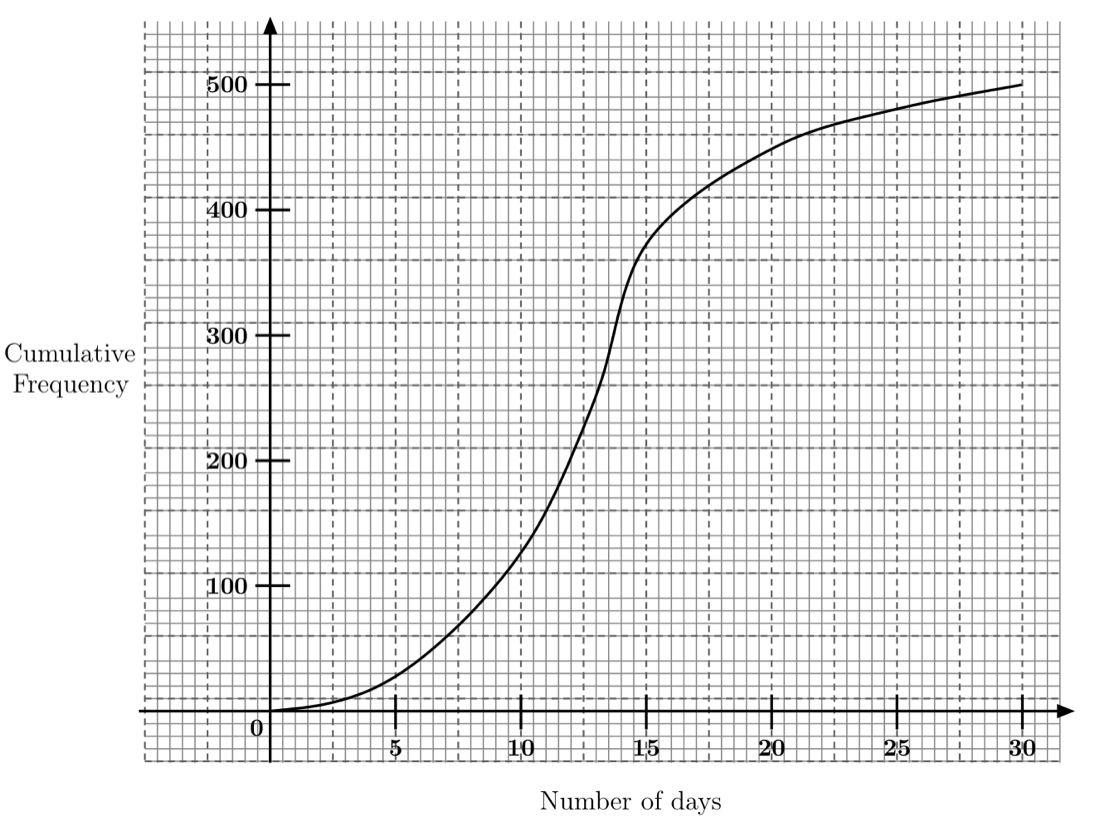
Use the curve to estimate
the median number of days, [1]
the interquartile range of the number of days, [2]
the percentage of patients who stayed more than 20 days in the hospital. [2]
In February 2022, the same survey was carried out again on another 500 patients with the following result shown in the box-and-whisker plot below.
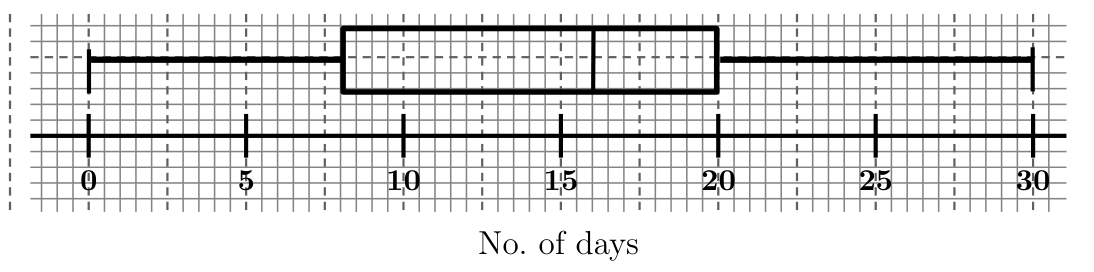
Make two comments comparing the number of days stayed in the hospital in February 2021 and February 2022.
Use figures to support your answer. [3]One patient in February 2021 was selected at random.
Find the probability that the patient stayed for at most 20 days. [1]
Two patients in February 2022 were selected at random.
Find the probability that one of the patients stayed for at most 8 days while the other stayed for more than 8 days. [2]
Show worked solution▾
(a)(i)
(a)(ii)
Interquartile range
(a)(iii)
Percentage
(b)
Median in February 2021 = 13 is less than median in February 2022 = 16.
Hence, the patients generally stayed longer in February 2022.
Interquartile range in Feb 2021 = 5 is less than interquartile range of Feb 2022 = 12.
Hence, the number of days stayed in February 2022 is generally less consistent/more wide spread.
(c)
(d)
Probability
Answer: (a)(i) 13 days (a)(ii) 5 days (a)(iii) (c) (d)